Reference no: EM13961000
How is it possible to measure the distribution of income among the inhabitants of a given country? One such measure is the Gini index, named after the Italian economist Corrado Gini who first devised it in 1912.
We first rank all households in a country by income and then we compute the percentage of households whose income is at most a given percentage of the country's total income. We define a Lorenz curve y = L(x) on the interval [0, 1] by plotting the point (a/100, b/100) on the curve if the bottom a% of households receive at most b% of the total income. For instance, in Figure 1 the point (0.4, 0.12) is on the Lorenz Clint for the United States in 2008 because the poorest 40% of the population received just 12% of the total income. Likewise the bottom 80% of the population received 50% of the total income, so the point (0.8.0.5) lies on the Lorenz curve. (The Lorenz curve is named after the American economist Max Lorenz.)
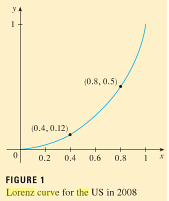
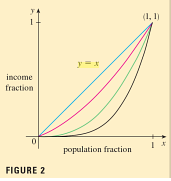
Figure 2 shows some typical Lorenz curves. They all pass through the points (0, 0) and (1, 1) and are concave upward. In the extreme case L (x) = x. society is perfectly egalitarian: The poorest a% of the population receives a% of the total income and so everybody receives the same income. The area between a Lorenz curve y = L (x) and the line y = x measures how much the income distribution differs from absolute equality. The Gini Index (sometimes called the Gini coefficient or the coefficient of Inequality) is the area between the Lorenz curve and the line y = x (shaded in Figure 3) divided by the area under y = x.
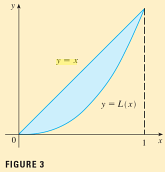
1. (a) Show that the Gini index C is twice the area between the Lorenz curve and the line y = x, that is G = 2 0∫1 [x - L(x)] dx
(b) What is the value of G for a perfectly egalitarian society (everybody has the same income)? What is the value of G for a perfectly totalitarian society (a single person receives all the income?)
2. The following table ((keyed from data supplied by the US Census Bureau) shows values of the Lorenz function for income distribution in the United States for the year 2008.
|
x
|
0.0
|
0.2
|
0.4
|
0.6
|
0.8
|
1.0
|
|
L (x)
|
0.000
|
0.034
|
0.120
|
0.267
|
0.500
|
1.00
|
(a) What percentage of the total US income was received by the richest 20% of the population in 2008?
(b) Use a calculator or computer to fit a quadratic function to the data in the table. Graph the data points and the quadratic function. Is the quadratic model a reasonable fit?
(c) Use the quadratic model for the Lorenz function to estimate the Gini index for the United States in 2008.
3. The following table gives values for the Lorenz function in the years 1970, 1980, 1990, and 2000. Use the method of Problem 2 to estimate the Gini index for the United States for those years and compare with your answer to Problem 2 c). Do you notice a trend?
|
x
|
0.0
|
0.2
|
0.4
|
0.6
|
0.8
|
1.0
|
|
1970
|
0.000
|
0.041
|
0.149
|
0.323
|
0.568
|
1.000
|
|
1980
|
0.000
|
0.042
|
0.144
|
0.312
|
0.559
|
1.000
|
|
1990
|
0.000
|
0.038
|
0.134
|
0.293
|
0.530
|
1.000
|
|
2000
|
0.000
|
0.036
|
0.125
|
0273
|
0.503
|
1.000
|
4. A power model often provides a more &carat fit than a quadratic model for a Lorenz function. If you have a computer with Maple or Mathematics fit a power function(y = ax') to the data in Problem 2 and use it o estimate the Gini index for the United States in 2008. Compare with your answer to pans (b) and (c) of Problem 2.
|
When businesses enter into international markets
: When businesses enter into international markets, they are often faced with ethical decisions related to business practices to facilitate successful entry into that market. Given the case above, please answer the following questions: a) please identi..
|
|
With staged customers proclaiming
: Maximillian Snell is having a very bad Monday at his “pre-owned” car dealership, Maximillian Motors. Known county-wide for his “eye-catching” (some would say obnoxious) television advertisements (with staged customers proclaiming “Thanks a million, M..
|
|
Calculate the threshold voltage
: Calculate the threshold voltage - the field effect mobility and Draw the Cif/CCox versus VG curve for the device if the metal gate is replaced with a p-type poly-Si gate doped to NA = NA1.
|
|
Revocation of the said agency
: Sunil borrowed a sum of Rs. 3 Lakh from Raj. Sunil appointed Raj as his agent to sell his land and authorized him to appropriate the amount of loan out of the sale proceeds. Afterwards, Sunil revoked the agency. Decide whether the revocation of ..
|
|
What is the value of g for a perfectly egalitarian society
: What is the value of G for a perfectly egalitarian society (everybody has the same income)? What is the value of G for a perfectly totalitarian society a single person receives all the income?
|
|
What is the power dispatched in the resistor
: The output of the signal generator is changed to a sine wave at a frequency of 2000 Hz. The power level is not changed. What is the power (in dBW) dissipated in the resistor with the filter in place between the signal generator and load resistor?
|
|
Organization competitive strategies or supply chain
: Based on research of the Nike Company, what recommended changes in the organization's competitive strategies or supply chain would you see beneficial or useful in today's economy (ex. system upgrade, inventory control, cheaper manufacturing proces..
|
|
Strategic information systems
: Strategic Information Systems (SIS) module entails one assignment. This has been designed to achieve the learning outcomes of the module and to develop the subject understanding of the student.
|
|
Why are ionic bonds weak in biology
: Why are ionic bonds weak in biology? What about covalent bonds?
|