Reference no: EM13822818
Question 1: Some defendants in criminal proceedings plead guilty and are sentenced without a trial, whereas others who plead innocent are subsequently found guilty and then are sentenced. In recent years, legal scholars have speculated as to whether sentences of those who plead guilty differ in severity from sentences for those who plead innocent and are subsequently judged guilty. Consider the data given below on defendants accused of robbery, all of whom, by the way, had previous prison records. At the .01 level of significance, do these data suggest that the proportion of all defendants in these circumstances who plead guilty and are sent to prison differs from the proportion who are sent to prison after pleading innocent and being found guilty?
|
|
Plea
|
|
|
Guilty
|
Not Guilty
|
|
Number judged guilty
|
n1 = 191
|
n2 = 64
|
|
Number sentenced to prison
|
x1 = 101
|
x2 = 56
|
|
Sample proportion
|
.529
|
.875
|
A. No, because the test value -1.96 is inside the interval (-2.58, 2.58)
B. Yes, because the test value 2.58 is inside the interval (-4.94, 4.94)
C. Yes, because the test value -4.94 is outside the interval (-2.58, 2.58)
D. No, because the test value -4.94 is outside the interval (-1.96, 1.96)
Question 2: Multiple myeloma or blood plasma cancer is characterized by increased blood vessel formulation in the bone marrow that is a prognostic factor in survival. One treatment approach used for multiple myeloma is stem cell transplantation with the patient's own stem cells. The following data represent the bone marrow microvessel density for a sample of 7 patients who had a complete response to a stem cell transplant as measured by blood and urine tests. Two measurements were taken: the first immediately prior to the stem cell transplant, and the second at the time of the complete response.
|
Patient
|
1
|
2
|
3
|
4
|
5
|
6
|
7
|
|
Before
|
158
|
189
|
202
|
353
|
416
|
426
|
441
|
|
After
|
284
|
214
|
101
|
227
|
290
|
176
|
290
|
Perform an appropriate test of hypothesis to determine if there is evidence, at the .05 level of significance, to support the claim that the mean bone marrow microvessel density is higher before the stem cell transplant than after the stem cell transplant? What is the value of the sample test statistic?
A. p = 2.7234
B. z = 1.8424
C. t = 2.7234
D. t = 1.8424
Question 3: A researcher hypothesizes that the variation in the amount of money spent on business dinners is greater than the variation of the amount of money spent on lunches. The variance of nine business dinners was $6.12 and the variance of 12 business lunches was $0.87. What is the test value?
A. 9.61
B. 7.03
C. 3.10
D. 49.50
Question 4: The marketing manager of a large supermarket chain would like to use shelf space to predict the sales of pet food. For a random sample of 12 similar stores, she gathered the following information regarding the shelf space, in feet, devoted to pet food and the weekly sales in hundreds of dollars.
|
Store
|
1
|
2
|
3
|
4
|
5
|
6
|
|
Shelf Space
|
5
|
5
|
5
|
10
|
10
|
10
|
|
Weekly Sales
|
1.6
|
2.2
|
1.4
|
1.9
|
2.4
|
2.6
|
|
Store
|
7
|
8
|
9
|
10
|
11
|
12
|
|
Shelf Space
|
15
|
15
|
15
|
20
|
20
|
20
|
|
Weekly Sales
|
2.3
|
2.7
|
2.8
|
2.6
|
2.9
|
3.1
|
Compute the value of the sample correlation coefficient between weekly sales and shelf space.
A. 0.827
B. 0.652
C. 0.684
D. 0.308
Question 5: In a simple linear regression analysis, the following sum of squares are produced:
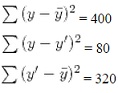
The proportion of the variation in Y that is explained by the variation in X is:
A. 80%
B. 50%
C. 20%
D. 25%
Question 6: The city of Oakdale wishes to see if there is a linear relationship between the temperature and the amount of electricity used (in kilowatts). Based on the data in the table below, is there a significant linear relationship between temperature and the amount of electricity used?
|
Temperature (x)
|
73
|
78
|
85
|
98
|
93
|
81
|
76
|
105
|
|
Kilowatts (y)
|
680
|
760
|
910
|
1510
|
1170
|
837
|
600
|
1800
|
A. No, the sample correlation coefficient is equal to 0.981, which does not provide evidence of a significant linear relationship.
B. Yes, the sample correlation coefficient is equal to 0.878, which provides evidence of a significant linear relationship.
C. Yes, the sample correlation coefficient is equal to 0.981, which provides evidence of a significant linear relationship.
D. No, the sample correlation coefficient is equal to 0.098, which does not provide evidence of a significant linear relationship.
Question 7: In a simple linear regression analysis, the following sum of squares are produced:
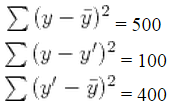
The proportion of the variation in Y that is explained by the variation in X is:
A. 80%
B. 50%
C. 20%
D. 25%
Question 8: A single variable X can explain a large percentage of the variation in some other variable Y when the two variables are:
A. mutually exclusive
B. inversely related
C. highly correlated
D. directly related
Question 9: Accepted characters: numbers, decimal point markers (period or comma), sign indicators (-), spaces (e.g., as thousands separator, 5 000), "E" or "e" (used in scientific notation). NOTE: For scientific notation, a period MUST be used as the decimal point marker.
Complex numbers should be in the form (a + bi) where "a" and "b" need to have explicitly stated values.
For example: {1+1i} is valid whereas {1+i} is not. {0+9i} is valid whereas {9i} is not.
A field researcher is gathering data on the trunk diameters of mature pine and spruce trees in a certain area. The following are the results of his random sampling.
Can he conclude, at the 0.10 level of significance, that the average trunk diameter of a pine tree is greater than the average diameter of a spruce tree?
|
Pine trees
|
Spruce trees
|
|
|
Sample size
|
25
|
35
|
|
Mean trunk diameter (cm)
|
55
|
48
|
|
Sample variance
|
100
|
140
|
- What is the test value for this hypothesis test?
- What is the critical value?
Question 10: Accepted characters: numbers, decimal point markers (period or comma), sign indicators (-), spaces (e.g., as thousands separator, 5 000), "E" or "e" (used in scientific notation). NOTE: For scientific notation, a period MUST be used as the decimal point marker.
Complex numbers should be in the form (a + bi) where "a" and "b" need to have explicitly stated values.
For example: {1+1i} is valid whereas {1+i} is not. {0+9i} is valid whereas {9i} is not.
The marketing manager of a large supermarket chain would like to determine the effect of shelf space (in feet) on the weekly sales of international food (in hundreds of dollars). A random sample of 12 equal -sized stores is selected, with the following results:
|
Store
|
Shelf Space(X)
|
Weekly Sales(Y)
|
|
1
|
10
|
2.0
|
|
2
|
10
|
2.6
|
|
3
|
10
|
1.8
|
|
4
|
15
|
2.3
|
|
5
|
15
|
2.8
|
|
6
|
15
|
3.0
|
|
7
|
20
|
2.7
|
|
8
|
20
|
3.1
|
|
9
|
20
|
3.2
|
|
10
|
25
|
3.0
|
|
11
|
25
|
3.3
|
|
12
|
25
|
3.5
|
Using the equation of the regression line for these data, predict the average weekly sales (in hundreds of dollars) of international food for stores with 13 feet of shelf space for international food.
Question 11: Accepted characters: numbers, decimal point markers (period or comma), sign indicators (-), spaces (e.g., as thousands separator, 5 000), "E" or "e" (used in scientific notation). NOTE: For scientific notation, a period MUST be used as the decimal point marker.
Complex numbers should be in the form (a + bi) where "a" and "b" need to have explicitly stated values.
For example: {1+1i} is valid whereas {1+i} is not. {0+9i} is valid whereas {9i} is not.
A company has observed that there is a linear relationship between indirect labor expense (ILE) , in dollars, and direct labor hours (DLH). Data for direct labor hours and indirect labor expense for 18 months
Treating ILE as the response variable, use regression to fit a straight line to all 18 data points.
Using your estimated regression output, predict the indirect labor expenses for a month in which the company has 31 direct labor hours.
Question 12: Accepted characters: numbers, decimal point markers (period or comma), sign indicators (-), spaces (e.g., as thousands separator, 5 000), "E" or "e" (used in scientific notation). NOTE: For scientific notation, a period MUST be used as the decimal point marker.
Complex numbers should be in the form (a + bi) where "a" and "b" need to have explicitly stated values.
For example: {1+1i} is valid whereas {1+i} is not. {0+9i} is valid whereas {9i} is not.
Are America's top chief executive officers (CEOs) really worth all that money? One way to answer this question is to look at the annual company percentage increase in revenue versus the CEO's annual percentage salary increase in that same company. Suppose that a random sample of companies yielded the following data:
|
Percent change for corporation
|
15
|
12
|
3
|
12
|
28
|
6
|
8
|
2
|
|
Percent change for CEO
|
6
|
17
|
-4
|
12
|
32
|
-1
|
7
|
2
|
Do these data indicate that the population mean percentage increase in corporate revenue is greater than the population mean percentage increase in CEO salary? Use a 5% level of significance. What is the p-value associated with this test of hypothesis?
Question 13: Accepted characters: numbers, decimal point markers (period or comma), sign indicators (-), spaces (e.g., as thousands separator, 5 000), "E" or "e" (used in scientific notation). NOTE: For scientific notation, a period MUST be used as the decimal point marker.
Complex numbers should be in the form (a + bi) where "a" and "b" need to have explicitly stated values.
For example: {1+1i} is valid whereas {1+i} is not. {0+9i} is valid whereas {9i} is not.
Are America's top chief executive officers (CEOs) really worth all that money? One way to answer this question is to look at the annual company percentage increase in revenue versus the CEO's annual percentage salary increase in that same company. Suppose that a random sample of companies yielded the following data:
|
Percent change for corporation
|
15
|
12
|
3
|
12
|
28
|
6
|
8
|
2
|
|
Percent change for CEO
|
6
|
17
|
-4
|
12
|
32
|
-1
|
7
|
2
|
Do these data indicate that the population means percentage increase in corporate revenue is greater than the population mean percentage increase in CEO salary? Use a 5% level of significance. What is the critical value that you would use to conduct this test of hypothesis?
Question 14: Accepted characters: numbers, decimal point markers (period or comma), sign indicators (-), spaces (e.g., as thousands separator, 5 000), "E" or "e" (used in scientific notation). NOTE: For scientific notation, a period MUST be used as the decimal point marker.
Complex numbers should be in the form (a + bi) where "a" and "b" need to have explicitly stated values.
For example: {1+1i} is valid whereas {1+i} is not. {0+9i} is valid whereas {9i} is not.
Researchers conducted an experiment to measure the effect of a drug on improving the quality of sleep as determined by how many more minutes of REM sleep were measured for each participant. One group of participants were given the experimental drug; the other (control) group was given a placebo. Does the evidence indicate that the drug improved the amount of REM sleep at a 0.01 level of significance? Answer each of the following parts.
|
|
Experimental group
|
Control group
|
|
Sample size
|
35
|
50
|
|
Mean sleep improvement
|
12.8
|
9.1
|
|
Sample variance
|
56.3
|
61.2
|
What is the test value for this hypothesis test?
What is the P-value for this hypothesis test?
What is the conclusion of this hypothesis test? Choose one.
1. There is sufficient evidence to show that the experimental drug improved the quality of sleep.
2. There is not sufficient evidence to show that the experimental drug improved the quality of sleep.
3. There is sufficient evidence to show that the quality of sleep is different for the experimental drug than for the control drug.
4. There is not sufficient evidence to show that the control drug decreased the quality of sleep.
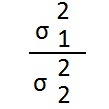
Question 15: When testing the equality of two population variances, the test statistic is the ratio of the population variances; namely
Question 16: If there is no linear relationship between two variables X and Y, the coefficient of determination, R2, must be ± 1.0.
Question 17: In a simple linear regression problem, the least squares line is y' = -3.2 + 1.3X, and the coefficient of determination is 0.7225. The coefficient of correlation must be -0.85.