Reference no: EM131248678
Part I - Quality Control
1. Managing Quality at the awesome Amusement Park
The amusement park has bought new technology called Crystal X. When a customer enters the line, it predicts the wait time range. On the Orbiter roller coaster, the predicted range is 5 to 10 minutes. The amusement park has sampled the times customers wait and found the average time was 8 minutes and the standard deviation is 1.5 minutes, normally distributed. Customers like some anticipation and don't mind waiting 5 minutes. However, when the wait is longer than 10 minutes, they file complaints via Yelp.
a. Fill in the following table.
b. Is the process capable at the 3 sigma level? Why or why not?
c. What is the probability of a defect; that is that the customers will become frustrated with the service level? Draw the appropriate diagram and find the probability.
Part II: Inventory Management
1. A local service station is open 7 days per week, 365 days per year. Sales of 10W40 grade premium oil average 20 cans per day. Inventory holding costs are $0.50 per can per year. Ordering costs are $9 per order. Lead time is two weeks. Backorders are not practical - motorists drive away. ) The boss is concerned about inventory because demand really varies. The standard deviation of demand was determined from a data sample to be 6.15 cans per day. The manager wants a 94% service level.
a. Determine the order quantity at which the total inventory costs would be minimized?
b. What is the reorder point?
c. Illustrate the order quantity, reorder point, safety stock and lead time on a diagram where the Y-axis represents the number of oil cans and the x-axis represents the time. What is the maximum possible inventory in the system at any point of time?
2. Benetton is considering pooling its thread inventory by knitting sweaters, then dyeing. The current process orders already dyed thread in 4 colors, and then knits 4 colors of sweaters. They use the continuous review (Q, R) system to determine inventory levels. Demand for the year for each color sweater is forecasted to be normally distributed and independent from the other colors with a mean of 1500 and a standard deviation of 500. Lead time is 1 month and the service level is 85%.
a. What is the total inventory (using R) for all four sweaters?
b. Benetton is considering pooling, where they will instead order undyed thread, then later knit. What is the total inventory (using R) for all four sweaters now?
Part III - Process Analysis and Queuing
1. Managing the Process at the awesome Amusement Park
The amusement part is trying to develop some metrics. The park opens at 9 am. The gates close at 6 pm so no new customers can enter. Customers arrive at a continuous rate of 560 per hour. Customers leave at a continuous rate of 420 per hour (and do not return), starting at 9 am also.
(a) Draw an inventory buildup diagram (triangle) for the process. Please label it appropriately.
(b) Fill in the following information based on your diagram. If you need to show work, show it below.
|
Maximum number of people in the park
|
|
|
Time the number of people in the park reaches its maximmum
|
|
|
Average number of people in the park
|
|
|
Average time a customer spends in the park
|
|
|
Time park empties of customers
|
|
2. A local market research firm has just won a contract for several thousand small projects involving data gathering and statistical analysis. In the past the firm had assigned each project to a single member of its highly trained professional staff. This person would both gather and analyze data. With this approach, an experienced person could complete an average of 10 such projects in an eight hour day. The firm's management is considering assigning two people to each project in order to allow for specialization. The revised process would require the data gatherer to fill out a spreadsheet on the computer, check it, and transmit it to the analyst who would run the spreadsheet through the statistical analysis program. Data can be gathered on one project while the analysis is being completed on another, but the statistical analysis program can only analyze one data job at a time. With experience, the new process can be completed with a standard time of 20 minutes for data gathering and 30 minutes for the statistical analysis.
a. What is the capacity in each alternative? What is the labor productivity (i.e., output per labor hour)?
|
|
Original Process
|
Revised Process
|
|
Capacity
|
|
|
|
Labor Productivity
|
|
|
b. How long would it take to complete 1000 projects under each alternative? What would be the total number of labor hours needed (including possible idle times) per 1000 projects under each alternative?
|
|
Original Process
|
Revised Process
|
|
Time to complete 1000 projects
|
|
|
|
Number of labor hours per 1000 projects
|
|
|
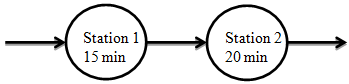
3. Each circle below represents a single server (one worker per station) and the time indicates the time for a single customer/job. There is no variability in service times and no buffers. Please fill out the table below to summarize this system. Don't forget to put units.
|
Cycle Time of System
|
|
|
Flow Time of System
|
|
|
Bottleneck
|
|
|
Utilization Station 1
|
|
|
Utilization Station 2
|
|
|
System Capacity
|
|
|
Average Inventory in System
|
|
4. Professor Nutty holds office hours every day to answer students' questions. Students arrive at an average rate of 11 per hour. Assume that arrivals are exponentially distributed. Professor Nutty can process students at an average rate of 14 per hour. Assume that the time each student takes is exponentially distributed.
a) Please fill in the following table. Please include the units.
|
A
|
|
|
Average inter arrival time
|
|
|
S
|
|
|
Average service time
|
|
|
m
|
|
|
Utilization
|
|
|
CVIAT
|
|
|
CVST
|
|
b) What is the average number of students waiting outside Professor Nutty's office?
c) How long do they wait outside Professor Nutty's office on average?
d) When the Professor Nutty is not helping students during office hours, she answers email questions regarding her class. During her 3 hours of office hours, how much time on average does she have to devote to answering emails?
e) Suppose that, as a result of student complaints, Professor Nutty decides to hire a TA. The TA and Professor Nutty will work at the same average rate as before (14 students per hour each), but the TA introduces more variability into the process. Now on average, the standard deviation of the service time is 3 min.
Please fill in the following table. Please include the units.
|
A
|
|
|
S
|
|
|
Utilization
|
|
|
m
|
|
|
CVIAT
|
|
|
CVST
|
|
|
Average number of students waiting outside the office
|
|
f) Professor Nutty is paid $150 per hour for office hours. TAs at Peanut and Butter University cost $150 per hour for office hours due to salary plus tuition remission. Complaints from students are very costly to Professor Nutty because she plans to win a teaching award for outstanding student service. In addition, one of her students is the daughter of the Dean. Thus, she estimates the cost per hour of a student waiting to be quite expensive, specifically, $50 per hour per student. Should Professor Nutty hire a TA for $150 per hour? The TA will work as described in part e. Please explain and show your work
Part IV - Short Answer Questions
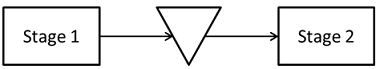
1. Explain what blocking and starving are and how they each may occur in the following system.
2. Why does Wal-Mart (US) use Every Day Low Price (EDLP) from an Operations Management perspective?
3. How does customer-introduced variability affect the fast food drive-thru process? Identify and briefly describe three ways. Then identify two possible ways to deal with each type of variability and classify each using the customer-introduced variability matrix. You may use the table to answer.
|
Type of Customer-Introduced Variability
|
Description
|
First way to deal and Classification
|
Second way to deal and Classification
|
|
|
|
|
|
|
|
|
|
|
|
|
|
|
|
4. Consider the two processes with variability shown below:
Which one will have on average the higher total number of products produced per hour?
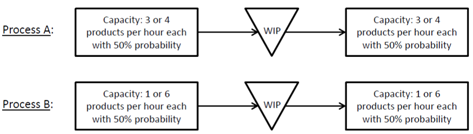
(a) Process A
(b) Process B
(c) They will have the same hourly production outcome.
5. Classify the supply chain in Kristen's cookies as (mostly) efficient or responsive? Why?
6. In a system where demand exceeds system capacity, work-in-process inventory piles up before the ______________________.
7. In class, ______________________represented hidden assumptions.
8. The best (your opinion) case was ________________________________________because:
Part V -Multiple Choice and True/False
Multiple choices: Please highlight (in yellow) or circle the correct answer.
1. Which of the following offers a potential for reducing inventory costs in a supply chain?
sharing POS data across the supply chain
sharing components across different products
having more warehouses
a and b
a and c
b and c
2. The purpose of safety stock is to
Protect the firm from a sudden decrease in demand
Replace failed units with good ones
Eliminate the possibility of a stock-out
Control the likelihood of a stock-out due to the variability of demand during lead time
Eliminate the likelihood of a stock-out due to erroneous inventory tally
For questions 3-5, refer to the figures below. The figures show optimal EOQ inventory policies for two different companies and for the same time horizon.
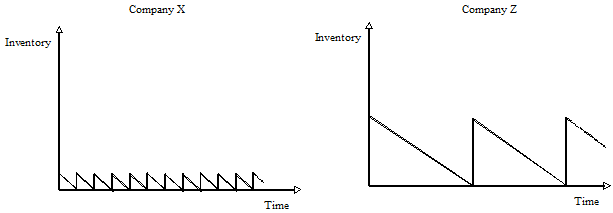
3. If both companies have the same annual demand, D, and the same fixed cost, K, per order, which of the companies has a higher unit inventory holding cost h?
Company X
Company Z
They have the same holding cost
Cannot tell from the information given
4. If both companies have the same annual demand, D, and the same unit inventory holding cost, h, which of the companies has a higher fixed cost K per order?
Company X
Company Z
They have the same order cost
Cannot tell from the information given
5. If both companies have the same annual demand, D, then on average, which of these companies holds less inventory for the same time horizon?
Company X
Company Z
They hold the same amount of inventory on average
Cannot tell from the information given
True/False, write T/F or True/False
6. ________Your supplier's supplier is a third tier supplier.
7. ________ A high-end, customized furniture manufacturer, would most likely employ an assembly-line type of process.
8. ________The idea behind Pareto charts is that working with the majority of possible causes is needed to significantly improve quality.
Attachment:- Reference material.zip