Provide a brief description of the main features

Assignment Help Basic Statistics
Reference no: EM1322618

Simple linear regression equation.

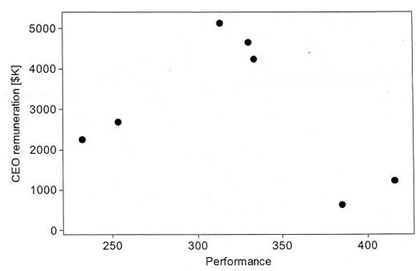
A stock market analyst at the Newyork Stock Exchange was interested in the relationship between company performance and performance related pay to Chief Executive Officers (CEOs) for selected companies form the Dow Jones index, prior to the 2008 banking crisis. She measured the annual performance over the accounting year 2007-08 for 7 randomly selected companies of interest, using a recognized balanced score card index. She then collated the corresponding performance related payment for the corresponding CEO of each of the companies of interest as shown in table. Her findings are exhibited in the scatter plot in figure.

a) Provide a brief description of the main features of these data from the scatter plot.

b) The (Pearson) Correlation Coefficient betwee these two random variables was calculated. Three competing values for this are given in table. Identify the correct value based on the scatter plot and regression output in table. You must clearly expalin tour selection and why you have rejected the two ther values.

c) It is decided to fit these data using a  regression model:

i) Explain why you would use performance as the predictor variable and performane related pay as the dependent variable in such a model.

ii) Provide a formal linear regression model to represent these data. You must define each term in the model.

d) The results of the regression are exhibited in table. Assuming that the model assumption hold, conduct formal tests on the regression coefficients. You must clearly state H0 and H1 and your conclusions for both tests.

e) Provide an expression for the final model based entirely on your answers to part (d) and clearly explain what this represents.

Performance

Performane related pay

333.7

4,246.40

415.9

1,231.61

253.2

2,696.42

231.8

2,626.81

385.0

641.61

330.4

4,660.56

313.6

5,139.75


Type

Sample Correlation

Coefficient value

A

-0.929

B

-0.005

C

-0.315


Predictor

Coefficient

Standard error

t-Statictic

P - value

Intercept

5684

3702

1.54

0.185

Performance

-8.35

11.25

-0.74

0.491

1730_Simple linear regression equation.png

Reference no: EM1322618

Questions Cloud

Paired samples t-test for the given data : Paired samples t-test for the given data - financial advice from the voluntary organization - A local voluntary organization affiliated to the Citizens Advice Bureau offers free financial advice to residents in the area who are registered debtors
Estimate the probability of winning-dice probabilities : Using classical methods discussed in class, try to estimate the probability of winning.
Comparison of paired and unpaired samples test : Comparison of paired and unpaired samples test - Identify which of the two tests (Independent samples and Paired samples) test is the preferred test and justify your choice.
Dice probabilities using excel : If the player does not win or lose on his second roll he continues to roll, using the same criteria given for the second roll.
Provide a brief description of the main features : Provide a brief description of the main features of these data from the scatter plot and Describe why you would use performance as the predictor variable and performane related pay as the dependent variable in such a model.
Probability by normal approximation for data : What is the probability that the next 100 customers will spend an average of less than $56 on dinner?
Simulate the arrival of cars at the service station : Simulate the arrival of cars at the service station for 20 arrivals and compute the average time between stations and Simulate the arrival of the cars at the service station for 1 hour
Finding probability of a rating : If an applicant is randomly selected, find the probability of a rating that is between 200 and 275.
Model assumptions for a regression model : Fitting of multiple linear regression equation - Give a list of the model assumptions for a regression model.

Reviews

Write a Review


Basic Statistics Questions & Answers

  Average value of sales

The manager is concerned that sales are slipping, after taking into account the average value of sales for four consecutive Saturdays being $4800.

  Find out the number of chicks we expect that will hatch

Rhode Island Red Chickens the incubation time for Rhode Island Red chicks is normally distributed to find out the number of chicks we expect that will hatch.

  Testing difference between two population means

Do the thinner cans appear to be strong enough so that they are not crushed when the top lids are pressed onto the sides?

  Level of significance-convincing evidence

At the .05 level of significance, is there convincing evidence that the number of absences per employee has increased?

  Correct pair of hypotheses

An independent financial advisor claims an average rate of return, μ, on a particular investment is at least 7%. In testing her claim, the correct pair of hypotheses is:

  Study states probability in a queuing theory

To determine the efficiency of the current ticket operation, Mike wishes to examine several queue operating characteristics.

  Smallest standard deviation to the statistic

Assuming the population is large, which sample size will give the smallest standard deviation to the statistic and select the numbers for the first five to be interviewed.

  Relationship from sample information

At the .01 significance level, is there a relationship between job pressure and age?

  Find the required probability for the normal distribution

What is the proportion of people surveyed that rated the subway system from 3 to 4. What is the proportion of people surveyed rated the Subway System from 1 to 3.

  Explain observational and experimental study designs

A study published in the New England Journal of Medicine (Aug. 2001) suggests that it's dangerous to enter a hospital on a weekend. During a 10-year period, researchers tracked over 4 million emergency admissions to hospitals in Ontario, Canada. T..

  Pair of dice probability

A pair of dice is rolled. What is the probability of each of the following? (Round your answers to three decimal places.)

  Conclude how woodco can maximize its revenue

Woodco manufactures tables and chairs. Each table and chair must be made entirely out of oak or entirely out of pine. A total of 150 board feet of oak and 210 board feet of pine are available.

Free Assignment Quote

Assured A++ Grade

Get guaranteed satisfaction & time on delivery in every assignment order you paid with us! We ensure premium quality solution document along with free turntin report!

All rights reserved! Copyrights ©2019-2020 ExpertsMind IT Educational Pvt Ltd