Reference no: EM131672449
Management Science Assignment Questions-
Question 1 - The OFLT Trucking Company needs to determine whether they should increase their fleet size or not. Since their ultimate objective is to satisfy the certain percentage of nationwide transportation demand, they obtained the following data representing total transportation demand in billions of dollars. (You can copy tables into Excel)
Table 1. Demand for transportation
|
Year
|
Total transportation demand
|
|
1980
|
332.6
|
|
1985
|
486.4
|
|
1990
|
598.3
|
|
1991
|
595.8
|
|
1992
|
638.0
|
|
1993
|
682.7
|
|
1994
|
742.0
|
|
1995
|
772.1
|
|
1996
|
828.1
|
|
1997
|
896.4
|
|
1998
|
931.1
|
|
1999
|
1,009.4
|
|
2000
|
1,059.9
|
|
2001
|
1,052.6
|
|
2002
|
1,075.4
|
|
2003
|
1,097.3
|
|
2004
|
1,160.5
|
|
2005
|
1,248.2
|
|
2006
|
1,312.4
|
|
2007
|
1,391.1
|
|
2008
|
1,359.7
|
|
2009
|
1,175.6
|
|
2010
|
1,320.2
|
|
2011
|
1,467.1
|
|
2012
|
1,560.5
|
|
2013
|
1,608.0
|
|
2014
|
1,661.1
|
|
2015
|
1,630.6
|
|
2016
|
1690.5
|
Source: U.S. Department of Commerce, Bureau of Economic Analysis
a) Plot the time series data and comment on the pattern you observe.
b) Use weighted moving average method to forecast the demand for 2017.
c) Use exponential smoothing with optimal α to forecast the demand for 2017.
d) Use regression method to forecast the demand for 2017-2020.
e) Compute the following measures of forecast accuracy: mean absolute error, mean squared error, mean absolute percentage error for your forecasts in parts b, c and d.
f) Determine the most accurate forecast method and estimate the demand for 2017.
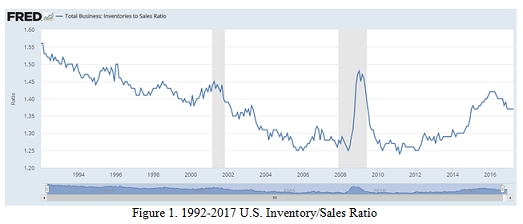
Question 2 - One of the important metric for retailing industry is the inventory to sales ratio. The U.S. inventory/sales ratio data has been collected by US Census Bureau and the data between 1992-present is presented in Figure 1. The full dataset is available in mrtsinv92-present.xlsx. As an entrepreneur with business analytics skills, you are supposed to analyze the data in this file and decide which retail sector (NAICS code) to invest in and the best time to open your stores.
Prepare a report that summarizes your findings, forecasts, and recommendations based on your answers to the following questions:
a) Construct a time series plot for adjusted monthly retail inventories of all NAICS codes (441, 442,443, 444, 445, 448, 452, 4521) between 1992-2017. What type of pattern exists in the data?
b) Choose three NAICS codes and forecast the monthly retail inventories for the next 15 months using a dummy variable (multiple regression) approach.
c) Based on your forecast, decide which of the three businesses you would invest in.
Question 3 - During the next four months, a customer requires, respectively, 500, 650, 1000, and 700 units of a commodity, and no backlogging is allowed (that is, the customer's requirements must be met on time). Production costs are $150, $180, $140, and $170 per unit during these months. The storage cost from one month to the next is $20 per unit (assessed on ending inventory). It is estimated that each unit on hand at the end of month 4 can be sold for $600. Assume there are 10 units of beginning inventory.
a) Determine how to minimize the net cost incurred in meeting the demands for the next four months.(Write your notation, LP formulation explicitly, submit your managerial reports with computer models, solutions, answer and sensitivity reports attached.)
b) If the production costs are all set to $150, would your solution change?
Question 4 - A retail company produces shirts at five different plants. The shirts then shipped to one of three warehouses, where it is stored until it is shipped to one of the company's four retail customers. All of the inputs for the problem are given in the as follows:
- The plant capacities
- The cost per unit of producing shirt at each plant and shipping it to each warehouse
- The cost of shipping a shirt from each warehouse to each retailer customer
- The customer requirements (demand)
- The fixed annual cost of operating each plant and warehouse
Plant to warehouse unit production, shipping costs, plant fixed costs, capacities
|
|
To
|
|
|
Warehouse 1
|
Warehouse 2
|
Warehouse 3
|
Fixed cost
|
Capacity
|
|
From
|
Plant 1
|
$6
|
$7
|
$5
|
$15,000
|
500000
|
|
Plant 2
|
$7
|
$5
|
$7
|
$35,000
|
200000
|
|
Plant 3
|
$8
|
$4
|
$9
|
$40,000
|
300000
|
|
Plant 4
|
$5
|
$6
|
$7
|
$50,000
|
400000
|
|
Plant 5
|
$7
|
$6
|
$5
|
$40,000
|
400000
|
Warehouse to customer unit shipping costs, warehouse fixed costs
|
|
To
|
|
|
Retailer 1
|
Retailer 2
|
Retailer 3
|
Retailer 4
|
Fixed cost
|
|
From
|
Warehouse 1
|
$6
|
$8
|
$4
|
$7
|
$3,000
|
|
Warehouse 2
|
$7
|
$4
|
$6
|
$8
|
$4,000
|
|
Warehouse 3
|
$5
|
$5
|
$5
|
$5
|
$3,000
|
|
Demand
|
400000
|
300000
|
250000
|
350000
|
|
The company must decide which plants and warehouses to open, and which routes from plants to warehouses and from warehouses to retailers to use. All customer demand must be met. A given retailer's demand can be met from more than one warehouse, and a given plant can ship to more than one warehouse.
1. Draw the network representation for this problem.
2. Write down the linear programming formulation with notation.
3. Use a solver to find the optimal solution and report your solution.
Question 5 - The Textile Mill produces five different fabrics. Each fabric can be woven on one or more of the mill's 38 looms. The sales department's forecast of demand for the next month is shown below, along with data on the selling price per yard, variable cost per yard, and purchase price per yard. The mill operates 24 hours a day and is scheduled for 30 days during the coming month.
|
Fabric
|
Demand (yards)
|
Selling price ($/yard)
|
Variable Cost ($/yard)
|
Purchase Price ($/yard)
|
|
1
|
16,500
|
0.99
|
0.66
|
0.80
|
|
2
|
22,000
|
0.86
|
0.55
|
0.70
|
|
3
|
62,000
|
1.10
|
0.49
|
0.60
|
|
4
|
7,500
|
1.24
|
0.51
|
0.70
|
|
5
|
62,000
|
0.70
|
0.50
|
0.70
|
The mill has two types of looms: dobbie and regular. The dobbie looms are more versatile and can be used for all five fabrics. The regular looms can produce only three of the fabrics. The mill has a total of 38 looms: 8 are dobbie and 30 are regular. The rate of production for each fabric on each type of loom is given in the following table. The time required to change over from producing one fabric to another is negligible and does not have to be considered.
|
Loom Rate (yards/hour)
|
|
Fabric
|
Dobbie
|
Regular
|
|
1
|
4.63
|
-
|
|
2
|
4.63
|
-
|
|
3
|
5.23
|
5.23
|
|
4
|
5.23
|
5.23
|
|
5
|
4.17
|
4.17
|
The Textile Mill satisfies all demand with either its own fabric or fabric purchased from another mill. Fabrics that cannot be woven at the Scottsville Mill because of limited loom capacity will be purchased from another mill. We use following linear programming model to maximize the profit of the Textile Mill and to answer the management's questions:
Let
X3R = Yards of fabric 3 on regular looms
X4R = Yards of fabric 4 on regular looms
X5R = Yards of fabric 5 on regular looms
X1D = Yards of fabric 1 on dobbie looms
X2D = Yards of fabric 2 on dobbie looms
X3D = Yards of fabric 3 on dobbie looms
X4D = Yards of fabric 4 on dobbie looms
X5D = Yards of fabric 5 on dobbie looms
Y1 = Yards of fabric 1 purchased
Y2 = Yards of fabric 2 purchased
Y3 = Yards of fabric 3 purchased
Y4 = Yards of fabric 4 purchased
Y5 = Yards of fabric 5 purchased
Max 0.61X3R + 0.73X4R + 0.20X5R + 0.33X1D + 0.31X2D + 0.61X3D + 0.73X4D + 0.20X5D+ 0.19Y1 + 0.16Y2 + 0.50Y3 + 0.54Y4
Subject to:
0.1912X3R + 0.1912X4R + 0.2398X5R ? 21600 (Regular Hours Available)
0.21598X1D + 0.21598X2D + 0.1912X3D + 0.1912X4D + 0.2398X5D ? 5760 (Dobbie Hrs Available)
X1D + Y1 = 16500
X2D + Y2 = 22000(Demand Constraints)
X3R + X3D + Y3 = 62000
X4R + X4D + Y4 = 7500
X5R + X5D + Y5 = 62000
ALL variables >=0
OPTIMAL SOLUTION OBTAINED WITH LINGO:
|
Optimal Objective Value
|
|
|
62531.49090
|
|
|
|
|
|
|
Variable
|
Value
|
Reduced Cost
|
|
X3R
|
27707.80815
|
0.00000
|
|
X4R
|
7500.00000
|
0.00000
|
|
X5R
|
62000.00000
|
0.00000
|
|
X1D
|
4668.80000
|
0.00000
|
|
X2D
|
22000.00000
|
0.00000
|
|
X3D
|
0.00000
|
-0.01394
|
|
X4D
|
0.00000
|
-0.01394
|
|
X5D
|
0.00000
|
-0.01748
|
|
Y1
|
11831.20000
|
0.00000
|
|
Y2
|
0.00000
|
-0.01000
|
|
Y3
|
34292.19185
|
0.00000
|
|
Y4
|
0.00000
|
-0.08000
|
|
Y5
|
0.00000
|
-0.06204
|
|
|
|
|
Constraint
|
Slack/Surplus
|
Dual Value
|
|
1
|
0.00000
|
0.57530
|
|
2
|
0.00000
|
0.64820
|
|
3
|
0.00000
|
0.19000
|
|
4
|
0.00000
|
0.17000
|
|
5
|
0.00000
|
0.50000
|
|
6
|
0.00000
|
0.62000
|
|
7
|
0.00000
|
0.06204
|
|
|
|
|
|
|
|
Objective
|
Allowable
|
Allowable
|
|
Coefficient
|
Increase
|
Decrease
|
|
0.61000
|
0.01394
|
0.11000
|
|
0.73000
|
Infinite
|
0.01394
|
|
0.20000
|
Infinite
|
0.01748
|
|
0.33000
|
0.01000
|
0.01575
|
|
0.31000
|
Infinite
|
0.01000
|
|
0.61000
|
0.01394
|
Infinite
|
|
0.73000
|
0.01394
|
Infinite
|
|
0.20000
|
0.01748
|
Infinite
|
|
0.19000
|
0.01575
|
0.01000
|
|
0.16000
|
0.01000
|
Infinite
|
|
0.50000
|
0.11000
|
0.01394
|
|
0.54000
|
0.08000
|
Infinite
|
|
0.00000
|
0.06204
|
Infinite
|
|
|
|
|
RHS
|
Allowable
|
Allowable
|
|
Value
|
Increase
|
Decrease
|
|
21600.00000
|
6556.82444
|
5297.86007
|
|
5760.00000
|
2555.33477
|
1008.38013
|
|
16500.00000
|
Infinite
|
11831.20000
|
|
22000.00000
|
4668.80000
|
11831.20000
|
|
62000.00000
|
Infinite
|
34292.19185
|
|
7500.00000
|
27707.80815
|
7500.00000
|
|
62000.00000
|
22092.07648
|
27341.95794
|
a) What is the optimal production schedule and loom assignments for each fabric?
b) How many yards of each fabric must be purchased from another mill?
c) What is the maximum profit attainable with the suggested production schedule?
d) If the purchase price of fabric 3 is decreased by $0.10, would the optimal solution change?
e) If the mill increased the selling price of fabric 2 on dobbie looms to $1.00, would the production schedule change? How much profit change would you expect?
f) How much is it worth for the company to have an extra regular hour available?
g) How much is it worth for the company to have an extra dobbie hour available?
h) What is the maximum value of the 9th Dobbie Loom; i.e., how much they should be willing to pay for the additional dobbie loom?
i) Management would like to understand the effects of different demand levels for different fabrics on the optimal solution and the total profit. Discuss the range of feasibility and the value of extra demand for each fabric.
j) If the company has to choose only one fabric to promote by additional advertisement, which fabric they should choose and why?
k) If they increase the selling price for fabric 1 and 4 by $0.10 simultaneously, would the optimal solution change? What would be the optimal total cost?
l) After implementing lean strategies, they plan to increase available regular hours to 25000 and available dobbie hours to 4000. Will there be any savings or total cost increase?
In order to get full credit, you need to show all your work.
Attachment:- Assignment Files.rar