Reference no: EM133343414
Question 1. Data Analysis - Note this is not a Collaborative Problem
In this problem, implement code to analyze the Iris data sets by feature and plant species (class) using the test statistics listed in Table 1. In Module 3 under Content in Probability document Table 1 can be used as a reference.
(a) Perform statistics of each feature and class using the test statistics listed in Table 1. You may use built-in function for your solution. Your results should be in a table that is easy to follow and reference.
(b) Perform analysis and provide an explanation of what each of the statistics pro- vides of the data. The analysis should reference your table from Part (a). What conclusions can you make based on these statistics?
For clarification, the analysis should be done by feature followed by class (flower species). This analysis should provide insight into the Iris data set. The analysis should be put into tables for easy understanding and referencing. The Iris data set is represented by the [150 × 4] matrix X, [1 × 4] vector x¯ is the mean of the four features for all observations, x1 is the [150 × 1] vector representing the sepal length, x2 is the [150 × 1] vector representing the sepal width, x3 is the [150 × 1] vector representing the petal length, and x4 is the [150 × 1] vector representing the petal width. Taking the notation a step further, let x1,c represents the vector for sepal length by class (species) c = [1, 2, 3] (Setosa, Versicolor, Virginica), specifically, x1,1 be the [50 × 1] vector representing the sepal length for class 1 (Setosa), x1,2 be the [50 × 1] vector representing the sepal length for class 2 (Versicolor), and x1,3 be the [50 × 1] vector representing the sepal length for class 3 (Virginica).
Note: The Trimmed Mean is a variation of the mean which is calculated by removing val- ues from the beginning and end of a sorted set of data. The average is then taken using the remaining values. This allows any potential outliers to be removed when calculating the statistics of the data. Assuming the data in xs = [x1,s, x2,s, ..., xn,s] is sorted, the resulting
Table 1: Data Analysis Statistics
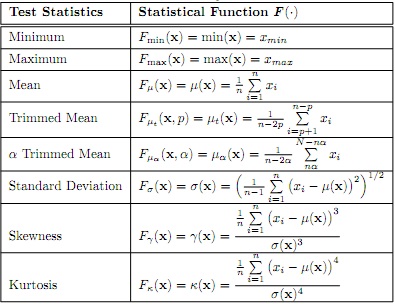
xs,p = [x1+p,s, x2+p,s,....., xn-p,s]. the trimmed mean allows the removal of extreme values influencing the mean of the data. For the α Trimmed Mean removes a % form the beginning and end of the sorted data, where α represents the number of observations based on the %.
2. Data Processing - and 4 Note this is not a Collaborative Problem
In this problem the Iris data set (iris.csv) will be used to begin understanding how to apply the data processing algorithms in the first three modules.
(a) Implement an algorithm to visually see two sets of features and the class they belong to. The use of seaborn: statistical data visualization is a good choice.
(b) Sorting
i. Develop an algorithm (pseudocode) to sort the four features in the dataset.
ii. Provide the running time and total running time of your algorithm in O-notation and T (n).
iii. Implement your algorithm in Python, recommend a class to use in later assignments. The use of a built in function or the use of the Python code provided.
iv. Determine if any of the four features can separate the three plant species.
v. Provide an explanation of the results:
A. Was there any feature that could separate the plant species; if so why, if not why not?
B. What was the metric used to determine separation? Explain why the metric was chosen.
(c) Data Normalization
i. Implement an algorithm to normalize the Iris data by feature. Verify your results by ensuring each feature has a range from 0 to 1.
(d) Outlier Removal
i. Design an algorithm (pseudocode) to remove in sequential order observations that are furthest from the data class mean by class (species).
ii. Provide the running time and total running time of your algorithm in O-notation and
T (n). State any assumptions you made in your breakdown.
iii. Implement your design, recommend creating a class for future use in other assignments.
iv. Determine if the data contains an outlier by plotting each class individually, the key is to plot two features at a time n different combinations, e.g., feature 1 vs feature 2, feature 1 vs feature 3, etc.
v. Provide an explanation of the results:
A. Was there any class that had obvious outliers; if so how did you determine the outlier, if not, why not?
B. What was the metric used to determine the outlier? Explain why the metric was chosen.
(e) Feature Ranking [10 points]
i. Design an algorithm (pseudocode) to rank the four features in the Iris dataset.
ii. Provide the running time and total running time of your algorithm in O-notation and
T (n). State any assumptions you made in your breakdown.
iii. Implement your design, recommended to create a class for future use.
iv. Determine if any of the four features can separate the three plant types.
v. Provide an explanation of the results:
A. Was there any feature that could separate the data by plant species; if so why, if not why not?
B. If a feature could not separate the plant types; what conclusion can drawn from this feature? 3
C. Can a metric be developed to complement the ranking method? Explain why or why not.
(f) Principal Component Analysis (PCA) [10 points]
i. Use the built-in PCA to perform analysis of the Iris data set using all species (classes).
ii. Use the built-in PCA to perform analysis of the Iris data set by specie (class).
iii. Provide an explanation of the results:
A. What is the difference between using all the data and using the data by specie (class)?
B. what is the percentage explained for each principal component?
C. how many principal components should you keep?
3. Artificial Intelligence - Note this is not a Collaborative Problem
In this problem we will expand our understanding of an AI technique to create a solution to the game of Tic-Tac-Toe. In the game of Tic-Tac-Toe there are set know rules to help play the game when two-players sit at a table to play on a piece of paper.
The Tic-Tac-Toe code is provided in the Module title Tic Tac Toe Code Based. For the game of Tic-Tac-Toe we will define your intelligent agent as being an autonomous entity that evaluates the current stat of the board being played and then using a mathematical function to determine where on an open position of the board to take the next move.
(a) In the utility player.py update the class to be functional as an agent to play against as shown in Figure 1. This algorithm uses a utility function for determining the next best move by evaluating each position on the current state of the game. A recommended agents utility function will be the evaluation function Eval = 3X2 + X1 (3O2 + O1) to measure the performance of each location on a board at the current state of the board. Feel free to use your own evaluation function. The variable Xn is defined as the number of n X′s on a given row, column or diagonal. The variables O's are defined as the number of n O′s on a given row, column or diagonal. For this assignment let n = 1, 2 since n = 3 will result in a win, additionally, let X be the AI and the human player O is playing against. Now, let's consider a unity function that assigns 1 to any position when the Xn is met and 1 to any position when the On is met. Any other row column or diagonal that does not meet the above definition are not evaluated or receive a 0. You must always check to see if your AI has a WIN and take that move, if not check to ensure your opponent does not have a WIN, if your opponent has a WIN possibility you must block your opponent. In your implementation you must test your implementation using the utility player tests.py and show your results from the test.
(b) Implement the goal-based-agent as shown in Figure 2 with a new class named goal player.py and a unit test class named goal player tests.py. The goal-based-agent must reach the goal of winning the Tic-Tac-Toe game when playing against a human player. You must always check to see if your AI has a WIN and take that move first, if not check to ensure your opponent does not have a WIN, if your opponent has a WIN possibility you must block your opponent. You must test your implementation, for the test cases use the utility player tests.py as your set of test cases.
(c) Provide the efficiency (running time) of both algorithms in O-notation.
(d) Provide the total running time of both algorithms (not the entire code base) in T (n) as well as showing the cost at each line of code in your algorithm.
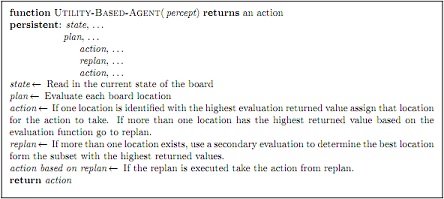
Figure 1: A utility-based agent.
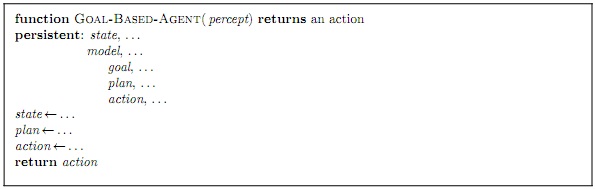
Figure 2: A goal-based agent.
Attachment:- iris.rar