Find the median of the following data

Assignment Help Mathematics
Reference no: EM13990544

1. Find the median of the following data. Show work.

 86       92        80        66        27        59        76        86        48

2. The mileages of 24 cars were compiled (in miles per gallons):

  24        20        28        29        19        36        20        26                       

  37        18        22         41       18        28         27       40

  42        36        44        32        30        37        29        35           

Summarize the data by constructing a frequency distribution and a relative frequency distribution, using intervals shown below. (Fill in the table.)

Mileage(miles per gallon)

Frequency

Relative Frequency (to the nearest thousandth)

14.5  -    19.5


19.5  -    24.5


24.5  -    29.5


29.5  -    34.5


34.5  -    39.5


39.5  -    44.5


Total


3. Consider the following table and pie graph (pie chart) before answering the question. Assume that the values in the given table are correct.

Major                  Number of Seniors        % of Seniors

Business                           633                           33

Computer Sci.                   194                           10

English                              236                           12

Biology                             134                             7

Psychology                         40                              2

Other majors                     681                            36

Total Number of Seniors      1918                         100

345_Cu.png

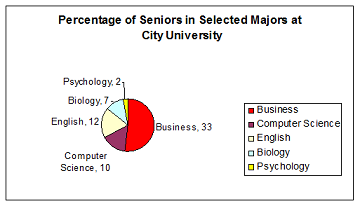
Which of the following best describes the most serious problem with the pie chart?

A. The sizes of the pie wedges are incorrect because the business wedge is too large and the English wedge is too small.

B. The numbers shown in the pie chart for the selected majors do not match the numbers in the % column of the table for those selected majors.

C. The sizes of all the pie wedges are incorrect because an additional wedge must be included.

D. The numbers in the pie chart should be followed by "%" because the values are percentages.

4. The number of calories per hot dog was determined for 10 brands of poultry hot dogs. The data are

184       102       157       102        137      152        107         91       104       164

(a) Find the median. Show some work/explanation.

(b) State the mode(s).

(c) Compute the sample mean, the sample variance, and the sample standard deviation.

Use the table below to help organize your work. Fill in the table.

xi

(xi - x-)

(xi - x-)2

184


102


157


102


137


152


107


91


104


164


Total:

Σxi =____

Total:

Σ(xi - x-) =_____

Total:

Σ(xi - x-)2  =______

Mean = _____________

Sample Variance = ________________

Standard Deviation= _______________

(d) What percentage of the data fall within one standard deviation of the mean? Show work/explanation.

5. Exam scores.Find the mean for the grouped data in the following table. Report the mean to the nearest tenth. Show work.(Extra space provided in table for scratch work.)

40 Exam Scores


Interval


Frequency


49.5 - 59.5


3


59.5 - 69.5


7


69.5 - 79.5


9


79.5 - 89.5


13


89.5 - 99.5


8


6. At a university, the probability that a student brings a laptop computer (laptop) to classes is0.66.Sixstudents from that university are selected at random.  (Report answers rounded to four decimal places. Show work.)      

(a) What is the probability that none of the six students brings a laptop to classes?

(b) What is the probability that all six of the students bring laptops to classes?

(c) What is the probability that at most one of the six students brings a laptop to classes?

Reference no: EM13990544

Questions Cloud

Prepare the a divisions income statement for the year ended : If the A division were to go out of business, the sale of its assets would bring in $141,000 in cash.
Produce a line graph of the hotel occupancy rate : (a) Produce a line graph of the hotel's occupancy rate per month. (b) Fit a least squares trendline to the hotel occupancy rate data.
Create an environment for terrorist groups to flourish : What effect has immigration had on the development of terrorist groups in Canada? Does Canada’s perceived liberal approach to immigration and refugees create an environment for terrorist groups to flourish?
Discuss the successes and failures of the change process : Using the Ashford University Library, find an article that reviews an organizational change initiative. Summarize the article and discuss the successes and failures of the change process. Analyze the strategies used for the change process and why ..
Find the median of the following data : Find the median of the following data and Summarize the data by constructing a frequency distribution and a relative frequency distribution, using intervals shown
A series of events and conditions existed in the old world : A series of events and conditions existed in the Old World at the dawn of the fifteenth century that made New World exploration not only possible but also desirable. Identify these events and conditions, and explain how much each helped set the stage..
Some of the ethical considerations of virtual teams : What are some of the tools (include mobile, VPNs, and Cloud resources) that can be used to help make virtual teams more successful when brainstorming or collaborating on a project? What are some of the ethical considerations of virtual teams and tech..
Calculate the net income for each situation : Calculate the net income (loss) for each situation?
Compare and comment on the results : (a) What is the 90% confidence interval estimate for the true mean monthly wages paid to farm workers? (b) What is the 99% confidence interval estimate for the true mean monthly wages paid to farm workers? (c) Compare and comment on the results of (a..

Reviews

Write a Review

Mathematics Questions & Answers

  Questions on ferris wheel

Prepare a Flexible Budget Gator Divers is a company that provides diving services such as underwater ship repairs to clients in the Tampa Bay area.

  Logistic map

This assignment has two question related to maths. Questions are related to bifurcation cascade and logistic map.

  Finding the probability of cards

This assignment has questions related to probabiltiy.

  Systems of ode

Find all the xed points, and study their stability and Draw the phase portrait of the system, as well as the graphs of the solutions in all relevant cases.

  Derive the boolean expression

Derive the Boolean Expression and construct the switching circuit for the truth table stated

  System of equations

Evaluate which equations are under-identified, just-identified, and over-identified.

  Linear programming problem

Linear programming problem consisting of only two constraints with one objective function.

  Find the natural domain

Find the natural domain of the given functions.

  Introduction to numerical methods

Compute the coecients of the polynomials using the term recurrence relation.

  Chart of the topological manifold

De?nition of smoothness of functions on a smooth manifold is chart independent and hence geometric.

  Mathematics in computing

Questions related on mathematics in computing.

  Complex problems

Complex problems

Free Assignment Quote

Assured A++ Grade

Get guaranteed satisfaction & time on delivery in every assignment order you paid with us! We ensure premium quality solution document along with free turntin report!

All rights reserved! Copyrights ©2019-2020 ExpertsMind IT Educational Pvt Ltd