Reference no: EM131110654
2007 Honors Examination in Statistics
1. Let Y have a Gamma(α, β) distribution with density given by
where α and β are positive. Let µ (µ > 0) be the mean of Y and σ2 be the variance of Y.
(a) Derive the mean of Y.
(b) Let Y1, Y2, ... be independent and identically distributed as in part (a). Let Yn- = 1/n i=1Σn Yi. The variance of Y is αβ2. What are the mean and variance of Yn-? Explain why.
(c) What is the probability density function (pdf) of W = 1/Y?
2. Let Yi, i = 1, . . . , n be independent and identically distributed Gamma(2,β) random variables.
(a) What is the likelihood function for β?
(b) Find the maximum likelihood estimator (MLE) of β.
(c) What is the large sample distribution of the MLE from part (b)?
Suppose β has prior distribution specified as an Inverse-Gamma(µ, ν) distribution. The probability density function of β is
f(β) = (1/Γ(µ)µν)(1/βµ+1) e-1/(βν)
for β, µ, ν > 0.
(d) What is joint density of the data and β?
(e) What is the posterior distribution of β given observations yi, i = 1, . . . , n?
(f) Show that as n becomes large (n → ∞) that the posterior mean of β is determined by the MLE.
3. Let the joint probability density function (pdf) for random variables X and Y be as follows:
f(x, y) = kx1/2y3/2
for 0 < x < y < 2 and f(x, y) = 0 otherwise.
(a) Find k.
(b) Are X and Y independent? Why or why not?
(c) What is the probability density function for X given that y = 3/2?
(d) What is the probability that both X and Y are less than 1?
4. Two sets of test results from students in a Geological and Atmospheric Sciences course are reported. Three hundred twelve students are reported in the first set of tests. The average score (on a ten-point scale) was 7.11. The standard deviation was 1.90. Two hundred ninety-nine students are reported in the second set of tests. Their average and standard deviation were 7.36 and 1.89, respectively.
(a) Given the information above, propose a test of whether or not the mean scores in the two sets of tests are the same. State hypotheses and any assumptions. Conduct the test and report a conclusion.
(b) It turns out (you learn later) that both tests were given in one class and they were pre and post tests. Of the 291 students who took both tests, the average of the difference between their pre- and post-test scores was 0.25. The standard deviation of the gains (post-pre) was 2.04. Given this new information, propose a test of whether or not the mean scores in the two sets of tests are the same. State hypotheses and any assumptions. Conduct the test and report a conclusion.
(c) Compare the results of the tests in the two parts. Comment on the effect of correlation between pre- and post-test scores.
5. Two hundred ninety-one students in a Geological and Atmospheric Sciences course took a pre-test and a post-test. Their scores are plotted below in the figure. A simple linear regression model is fit to the data. Some computer output is given below.
Figure 1: Plot of pre-test and post-test exam scores for 291 students: numbers indicate number of students with each pair of scores.
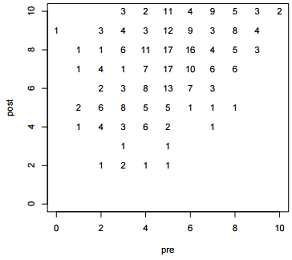
(a) Draw the estimated regression line on the graph. Interpret the meaning of the estimated slope. What do you predict on the post-test for a student with a pre-test score of 6?
(b) Compute the root mean squared error (RMSE) for the regression. Illustrate the RMSE on the graph.
(c) Compute the F statistic. Explain what a 'significant regression' means and determine whether or not this regression is significant.
6. Test data were collected from students in three schools. In school 1, teachers were given a short training course involving practice teaching sessions (training A) using computer technology in the classroom. Teachers in school 2 received training but without the practice sessions (training B). Teachers in school 3 are not scheduled to receive the training until next year. Students in all schools were given standardized grade-appropriate tests of basic mathematics skills. Below are the number of students in each school that scored at or above the standard and the numbers that scored below the standard on the exam.
|
Classroom:
|
Exam results
|
|
At or above standard
|
Below standard
|
|
School 1
|
192
|
15
|
|
School 2
|
2901
|
21
|
|
School 3
|
57
|
11
|
(a) Produce a 95% confidence interval for the difference between the percent of students at or above grade level in the school with training A and the school with training B. Interpret the results.
(b) Researchers want to test whether there is a difference in proportions of the children scoring at or above the standard for the three schools.
i. Compute the proportion at or above the standard separately for the three schools. Does there appear to be any difference?
ii. Assuming the chance that students score at or above the standard is really equivalent in the three schools, compute the proportion at or above the standard overall. Then, under the assumption of equivalence, compute the number of students in each school you would expect to be at or above standard and the number you would expect below the standard.
iii. The statistic used to test the hypothesis is X2 = ΣrowsΣcolumns(Orc - Erc)2/Erc, where Orc is the observed count in row r and column c in the table above and Erc is the expected value from the previous part. Compute this statistic.
iv. State a conclusion about the researchers interest. If you know the appropriate distribution to use for a statistical test, then use it. If not, then compare the test statistic value to a distribution with mean 2 and variance 4.
(c) Do you have any concern about the tests performed in the previous parts? Hint: classrooms have 25-30 students in them.