Reference no: EM131340039
Question 1. The logistics department of a large firm employs three "estimators" whose job it is to decide the likely cost of delivering their products to their customers. This enables them to negotiate with Third Party Logistics (3PL) providers for an acceptable price. In order to check if there is any serious discrepancy between the methods used by the three they were each asked to produce estimates for the same four jobs. The results (in hundreds of pounds) are shown in the table below:
|
|
|
Job Number |
|
|
|
1
|
2
|
3
|
4
|
|
Estimator
Number
|
1
|
6.2
|
5.0
|
4.6
|
6.6
|
|
2
|
6.3
|
5.4
|
4.9
|
6.8
|
|
3
|
5.9
|
5.4
|
4.4
|
6.3
|
(a) Does the data suggest any discrepancy between the estimators?
(b) Is it possible to identify any interaction between estimators and jobs? Explain your answer.
Question 2. A study of trends in logistics information systems published in the journal Industrial Engineering, found the greatest advances in computerisation were in transportation. It showed 90% of all industries contain open order shipping files in their databases. In a random sample of 10 firms, if x is the number of open order shipping files in their databases, then:
(a) What distribution is most likely to be appropriate for modelling the data?
(b) Find the probability that x = 8.
(c) Find the probability that x > 6.
(d) Find the mean and standard deviation of x.
Question 3 A study at Ulster University considered the correlation in fifteen SMEs between their abilities to carry out Continuous Improvement (CI) and their cultures of Innovation. For each of the fifteen firms a score was developed to indicate their capability in the two areas. The results are shown below:
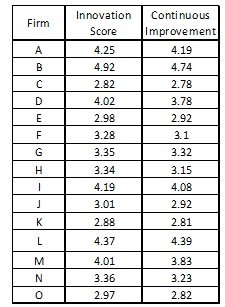
(a) Do the results suggest any significant difference between the scores for Innovation and those for CI?
(b) The authors of the report suggest that a firm's ability to Innovate can be predicted from their capability in CI. Does the data support this suggestion?
(c) Comment on the findings in parts (a) and (b). Do your answers indicate any difficulty in interpreting the results of the study?
(d) If a firm had a CI score of 3.5 calculate the 95% confidence limits for their predicted score for Innovation.
(e) Test the hypothesis that the graph should pass through the origin (i.e. a = 0). Explain what this means in practical terms.
Question 4.(i) A company buys springs to use in an assembly. The specification requires the "rate", i.e. the force required to compress the spring by one centimetre, to be within the range 35 Newtons ± 2.5 Newtons. A sample of one hundred springs was selected and the rate was measured using a standard test rig, with the results shown in the table below.
| Rate (N) |
Frequency
|
|
32.5
|
3
|
|
33.0
|
7
|
|
33.5
|
15
|
|
34.0
|
13
|
|
34.5
|
20
|
|
35.0
|
18
|
|
35.5
|
17
|
|
36.0
|
3
|
|
36.5
|
3
|
|
37.0
|
1
|
(a) Does it seem that the "rates" are Normally distributed? (Provide clear evidence for your conclusion).
(b) If the distribution were Normal, what proportion of all springs would be expected to lie outside the specification?
(c) From the sample, does it seem that the population mean is on target?
Question 5.(i) Complaints were made about the level of pollutants in the discharge from a certain factory. The factory refuted the complaints by showing the results of their own analysis of the discharges. However, the Environmental Health Agency claimed the method of analysis used by the firm was faulty. A comparison was made over nine days using two methods of analysis in parallel to check the pollution levels. The results (in ppm.) are shown below:
|
Day #
|
Method A
(firm's
method)
|
Method B
(EHA's
method)
|
|
1
|
11
|
18
|
|
2
|
37
|
35
|
|
3
|
35
|
38
|
|
4
|
42
|
36
|
|
5
|
34
|
47
|
|
6
|
35
|
48
|
|
7
|
48
|
57
|
|
8
|
32
|
28
|
|
9
|
33
|
42
|
Does the data suggest the firm's method does underestimate the level of pollution?
Question 5.(ii) A company making lamps has drawn a sample from its production line and measured the light output from each. The results, in microamps, are as follows:
9.1 9.8 9.5 10.4 10.7 10.2 9.8 10.0 10.3 10.1 9.6
At a later date second sample is drawn and tested, with the following results:
9.4 9.3 9.8 10.3 9.9 10.5 10.7 10.4 9.7 10.6
(a) Is there any evidence of a change in the performance of the lamps between the two dates?
(b) If there is a difference, calculate the 95% confidence limits for the difference.
(c) If not, calculate the 95% confidence limits for the mean light output.
|
Find the resultant velocity representing
: An airplane has an airspeed of 550 km/h bearing 48degrees° north of east. The wind velocity is 50 km/h in the direction 26° north of west. Find the resultant velocity representing the path of the airplane with respect to the ground.
|
|
What is the difference between a lattice and a crystal
: What is the difference between a lattice and a crystal? How many different 1-D lattices can you have?
|
|
What is the monoamine theory of depression
: Describe the process of action potential conduction and neurotransmission from one neuron to another, both electrically (including saltatory conduction) and chemically. Describe how a cell fires an action potential and be sure to address which str..
|
|
Determine how many dump trucks loads will be transported
: If each dump truck can transport 18 cubic yards, determine how many dump trucks loads will be transported? For calculation purposes, add a 15% "fluff factor" (add to the volume that will be transported).
|
|
Draw the graph relating the two variables
: Draw the graph relating the two variables - Does the data support the suggestion that engine size and fuel consumption are related? If so find the relationship between them and state the probable limits of the Regression Coefficient with 95% confi..
|
|
Compute tax loss on sale and related tax benefit
: An asset was purchased three years ago for $180,000. It falls into the five-year category for MACRS depreciation. The firm is in a 30 percent tax bracket. Compute the tax loss on the sale and the related tax benefit if the asset is sold now for $21,0..
|
|
Ring at the end of a chain that passes
: Two perpendicular forces act on a ring at the end of a chain that passes over a pulley and holds a crate. What is the weight of the crate if the horizontal force pulls at 92pounds and the vertical force pulls at 44 lb?
|
|
Evaluate each firms performance by comparing the firms
: Compute the total asset turnover, the net profit margin, the equity multiplier, and the return on equity for each firm. - Evaluate each firm's performance by comparing the firms with one another.
|
|
What is the time between current pulses
: Using data from Fig. 10-9a, calculate the power dissipated in the sample per unit volume when it is biased just below threshold if rc0 is chosen from the calculation of part (a). In general, does operation at a higher frequency result in greater p..
|