Reference no: EM131113006
1. A multivariate analysis has been undertaken on 22 non-metric (binary observation) variables recorded from 2026 skulls belonging to skeletons recovered from two burial sites of different historic periods; 18th cen- tury Spitalfields, London, and 4th century Poundbury, Dorset. The main aim of the analysis was to investigate differences between the skulls of the two sites on the basis of the recorded data. Using infor- mation collected on each skeleton, investigators were able to classify each skull as that of a female, juvenile or male, so that six subgroups were easily identified within the data. It was not possible in all cases to determine the sex of the juvenile skeletons so these skulls are included as a single group at each site. Inevitably, due to the conditions of the skulls, it was not possible to observe the presence or absence of all 22 features on each skull, so that the data set contains a lot of missing values, and one of the impor- tant aspects of the analysis undertaken was to take account of different methods for adjusting for this. The first analysis presented below con- siders the matrix of (squared) pythagorean distances calculated using all of the 22 variables following an angular transformation, and making adjustments for bias based on the number of observations. Three bias adjustments were made resulting in three distance matrices, D1, D2 and D3, the adjustments accounting for the total group size, average number of observations for each variable (within each group) or mini- mum number of observations, respectively. Table 1 shows the matrix of squared pythagorean distances DZ between the six groups (labelled PF, Pi' and PM for the female, juvenile and male groups from Poundbury, and SF, SJ and SM for the corresponding Spitalfields groups), which has been bias-adjusted using the average number of observations recorded for each variable. Table 1. Matrix of Squared Pythagoras Distances,
(a) Dixuss !Indy the aims clucceJ and ordinal Ealing geeetelly. making elate thy difference. tnutn the tan approached.
(tt) thttetie why Eddins the ethic= sea tree is theful ha de-teerniniug whither there see ear .thuietloia w of ettnet • low. taco& repethenntion of richielinsensional þs
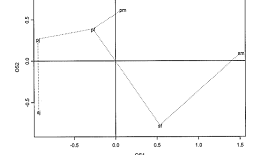
(t) Whet Jo Tivoli] sod :at ate.th the relmacishaps between the ma arid age Leonia of each of the Sythdleldi and Poundbory Uwe, Are ear <12-Terraces apps to itelletelt let ten pints? In each cath. does the supenzapoio; =ere= e70=31t tele inetiCato thy peahens with the reprocsitthota?
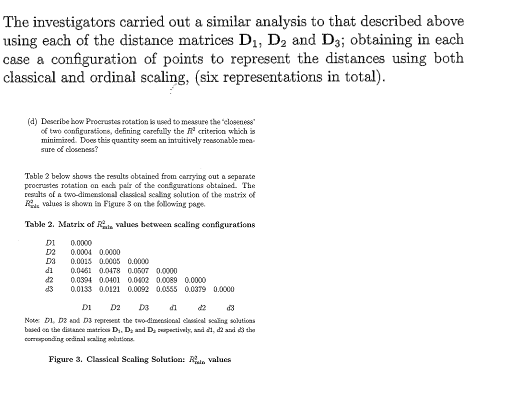
(e) Explain why a classical scaling of the RLa values is an appropriate means of comparing the representations of the 'skull' groups. Comment on what Figure 3 tells us about the differences between configurations based on the differing bias adjustments adopted in each distance measure.
The analysis was repeated using canonical variates, using just five of the original (presence/absence) variables, which were chosen to maximize the number of complete measurements across all six population groups. The number of measurements used in the analysis are recorded in Table 3 below.Table 3. Complete measurements for each group on five variables
|
|
Female
|
Juve.
|
Male
|
|
Spitalfields
Poundbriry
|
112
274
|
27
34
|
115
272
|
The canonical variates analysis produced the following eigenvalues of W-113:
Al = 0.6693, A2 = 0.2240, A3 = 0.0089, A4 = 0.0038, A5 = 0.0005.
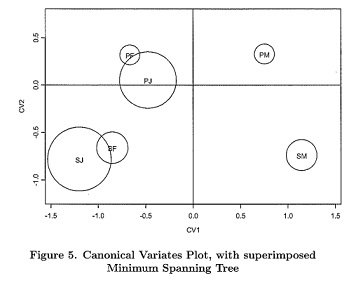
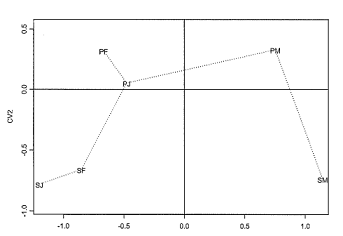
The group mean vectors have been plotted with respect to the first two canonical variates in Figure 4, with 95% confidence circles for the true means, and Figure 5 adds the minimum spanning tree. Additionally, Table 4 below shows the (squared) mahalanobis distances calculated between each group.
Table 4. Matrix of Squared Mahalanobis Distances
|
PF
|
0.000
|
|
|
|
|
|
|
PJ
|
0.264
|
0.000
|
|
|
|
|
|
PM
|
2.083
|
1.769
|
0.000
|
|
|
|
|
SF
|
1.012
|
0.837
|
3.560
|
0.000
|
|
|
|
SJ
|
1.549
|
1.624
|
5.110
|
0.243
|
0.000
|
|
|
SM
|
4.368
|
3.285
|
1.290
|
3.911
|
5.449
|
0.000
|
|
|
PF
|
PJ
|
PM
|
SF
|
SJ
|
SM
|
(f) Comment on the preceding analysis in as much detail as possible. What do the canonical variates represent, and how does this analysis compare with that presented earlier based on a classical scaling of the distance matrix D2?
2. (a) (i) Let x be apx 1 random vector with mean vector ps and covariance matrix E. In the context of Factor Analysis, define carefully what it means to say that the k factor model holds for x and show what structure this imposes on the covariance matrix E.
(u) Suppose a random sample is taken from a multivariate distribution in which the k factor model is assumed to hold. The maximum likelihood estimates of the factor loadings matrix A and the diagonal matrix of communalities * minimize the function F given by
F(A, If) = trace(E-1S) + -1121Si - P
where S denotes the sample covariance matrix and E the population covariance matrix as a function of A and W. Explain carefully how this function can be interpreted. Describe in detail how it can be used as the basis of an asymptotic goodnessof-fit test for the assumed k factor model.
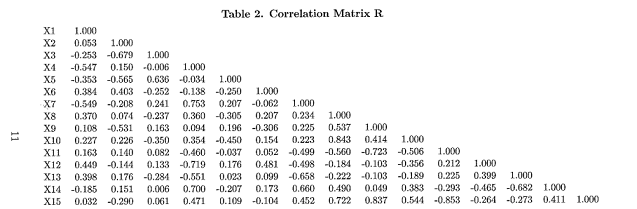
(b) The data for this question concern variables thought to be related to electricity consumption in 48 states in the US. Descriptions of the 15 variables are given in Table 1 below, and the sample correlation matrix It of the variables is given in Table 2.
Table 3
X1 log(price of gas)
X2 log(degree days heating)
X3 log(degree days cooling)
X4 log(percent homes with separate food freezers)
X5 log(percent homes with air conditioning)
X6 log(number of rooms per house)
X7 log(percent single-family dwellings)
X8 log(percent with electric water heaters)
X9 log(percent with electric heat)
X10 log(percent with electric cooking)
X11 log(price of electricity)
X12 log(population density)
X13 log(disposable per capita income)
X14 log(percent rural households)
X15 log(kilowatt hours per customer)
Maximum likelihood factor analysis was carried out on the correlation matrix, and six factors were extracted. The estimated raw factor loadings are given as Table 3 and following a varimax rotation in Table 4. ... continued
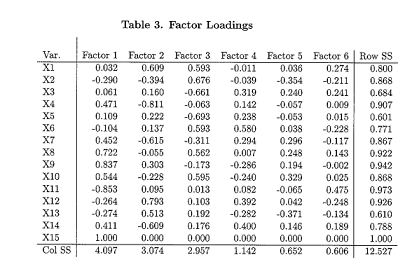

How can you interpret the calculated row and column sum of squares totals?
(ii) The factor axes defining the 6-dimensional factor space have been rotated (by varimax) so as to aid factor interpretation. Propose some desirable properties of factor loadings that might make interpretation easier, and that the varimax criterion attempts to produce.
(iii) Comment briefly on how the original correlation matrix and as fully as possible on the analysis. How would you interpret the 6 factors? What further comments on the variables, the factors or the analysis might you make?
Attachment:- 20111118100211413.rar
Attachment:- problems.zip