Vectors and matrices, MATLAB Programming

Assignment Help:

Vectors and Matrices:

The Vectors and matrices are used to store sets of values, all of which are similar type. A vector can either be a column vector or a row vector. The matrix can be visualized as a table of values. The dimensions of a matrix are r x c, here r is the number of rows and c is the number of columns. This is pronounced as "r by c." If the vector has n elements, the row vector would have dimensions 1 x n, and a column vector would have the dimensions n x 1. The scalar (one value) has dimensions 1 x 1. And hence, vectors and scalars are actually just subsets of matrices. Here are some diagrams shown below, from left to right, a scalar, a column vector, a row vector, and the matrix:

16_Vectors and Matrices.png

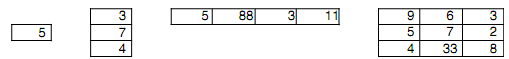
The scalar is 1 x 1, the column vector is 3 x 1 (3 rows by 1 column), the row vector is 1 x 4, and the matrix is 3 x3. All the values stored in these matrices are stored in what are termed as elements.

The MATLAB is written to work with matrices; the name MATLAB is short for "matrix laboratory." For this reason, it is very easy to generate vector and matrix variables, and there are so many operations and functions which can be used on vectors and matrices.

A vector in a MATLAB is equal to what is termed as a one-dimensional array in other languages. The matrix is equal to a two-dimensional array. Generally, even in the MATLAB, some operations which can be performed on either vectors or matrices are referred to as array operations. The word array also is often used to mean generically either a vector or a matrix.


Related Discussions:- Vectors and matrices

Matlab, hi, I would like to get quote for my matlab assignment help? thanks...

hi, I would like to get quote for my matlab assignment help? thanks

Find the distribution of data with matlab, how to make a histogram of data,...

how to make a histogram of data, example x=[5 6 3 2 5] and then find the distribution

#GUI, #create a matlab GUI for designing common emitter amplifier which pro...

#create a matlab GUI for designing common emitter amplifier which produces AC load lines based on the component values

Decision feedback equiliser, i want matlab code for DFB Equiliser and the o...

i want matlab code for DFB Equiliser and the output between tha number of iterations vs MSE

Sequence alignment and blast search, Calculating and Visualizing Sequence S...

Calculating and Visualizing Sequence Statistics Follow the instructions in this demo file to download a sequence and calculate and visualize its statistics. Save all the command

Function char - characters and encoding, Function char: The function c...

Function char: The function char does the opposite; it converts from any number type to the type char: >> char(numequiv) ans = a As the letters of the alphabet are

Matrix addition, Write a program in Mathlab for addition of two matrices.

Write a program in Mathlab for addition of two matrices.

Find the spectrum of waveform, (a) Find the spectrum of this waveform:  x =...

(a) Find the spectrum of this waveform:  x = [ exp( -[0:1:49]/10), exp(-[50:-1:1]/10)]. Subplot only the magnitude by using the spectrum program from the class notes. (b) Using

Need help with assignment, Hi I''m wondering if someone can help me with Ma...

Hi I''m wondering if someone can help me with Matlab coursework

CPM AND PERT, ACTIVITIES OF A PROJECT 1-2 1-3 1-4 1-5 2-6 3-6 3-7 4-7 5-7 7...

ACTIVITIES OF A PROJECT 1-2 1-3 1-4 1-5 2-6 3-6 3-7 4-7 5-7 7-6 6-8 7-8 THE COMMPANY LOSES 2,000 FOR EVERY WEEK THE PROJECT LASTS BEYOND 30 WEEKS. fOR EACH OF THE PROPOSALS; ACTIVI

Write Your Message!

Captcha
Free Assignment Quote

Assured A++ Grade

Get guaranteed satisfaction & time on delivery in every assignment order you paid with us! We ensure premium quality solution document along with free turntin report!

All rights reserved! Copyrights ©2019-2020 ExpertsMind IT Educational Pvt Ltd