Write a pseudo-code showing the list of steps to take for solving the given problem. In this process, you should identify the functions that are to be used in the program. Develop a Matlab program based on the designed algorithm. Correct the program for any syntax errors.
Test the program for any logic errors.
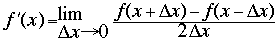
1.1 Derivative of a Function
The derivative of a continuous function f (x) is defined by the equation
In a sampled function, becomes
f'(x(¡)) = [f(x(i) + 1) - f(x(i)] / ?x
where ?x =( x(i) + 1) - x(i)
Assume that a vector vector vect contains n samples of a function taken at a spacing of dx per sample. Write a function that will calculate the derivative of this vector from above discrete equation. The function should check to make sure that dx is greater than zero to prevent divide-by-zero errors in the function.
To check your function, you should generate a data set whose derivative is known and compare the result of the function with the known correct answer. A good choice for a test function is sinx, whose derivative is cosx. Generate an input vector containing 100 values of the function sinx starting at x = 0 and using a step size ?x of 0.05. Take the derivative of the vector with your function, and then compare the resulting answers to the known correct answer. Calculate how close your function came to the correct value by computing error as sum of squared distance of all the 100 points.
1.2 Derivative in the Presence of Noise
Explore the effects of input noise on quality of the numerical derivative. First, generate an input vector containing 100 values of the function sinx starting at x = 0 and using a step size ?x of 0.05, just as you did in the above problem. Next, use function 'rand' to generate a small amount of random noise with a maximum amplitude of ±0.02, and add that random noise to the samples in your input vector. Note that the peak amplitude of the noise is only 2% of the peak amplitude of your signal, since the maximum value of sinx is 1. Now take the derivative of the function using the derivative function that you developed in the above problem. Calculate how close your function came to the correct value by computing error as sum of squared distance of all the 100 points.
YOU MUST USE THIS PROGRAM SKELETON FOR THIS LAB BUILD UPON THIS SKELETON
%SKELETON Program for Program3
%data.m returns the 100 sample values
x=data();
%Generate 3 function values (y1,y2,y3)
% and their derivatives (yd1,yd2,yd3)
[y1 yd1]=fn1(x);
[y2 yd2]=fn2(x);
[y3 yd3]=fn3(x);
%Add noise to the y-values
[y1_ns]=add_noise(y1,0.02);
[y2_ns]=add_noise(y2,0.02);
[y3_ns]=add_noise(y3,0.02);
%Compute derivative for each of the three functions with/without noise
my_yd1=my_derivative(x,y1);
my_yd1_ns=my_derivative(x,y1_ns);
my_yd2=my_derivative(x,y2);
my_yd2_ns=my_derivative(x,y2_ns);
my_yd3=my_derivative(x,y3);
my_yd3_ns=my_derivative(x,y3_ns);
%Compute Sum Square error of the derivative for each of the three functions
error1=sumsqerror(yd1,my_yd1);
error1_ns=sumsqerror(yd1,my_yd1_ns);
error2=sumsqerror(yd2,my_yd2);
error2_ns=sumsqerror(yd2,my_yd2_ns);
error3=sumsqerror(yd3,my_yd3);
error3_ns=sumsqerror(yd3,my_yd3_ns);
error1
error1_ns
error2
error2_ns
error3
error3_ns
1.3
What to Hand In
Run your program for THREE functions, where you know the derivatives. You need to generate data for these functions; one of this function is sinx, as described above. Print the error for each function, with and without noise, and make a script file for grading.
1.4 Write a new functions: factorial_loop(n) as described below, and run your own tests. Note: you must use the type of loop specified.
1. factorial_loop will use 'for' loop to compute factorial of n
Use the diary command to save your work into a file: lab09.txt you need to submit for grading. In the command window, type:
factorial_loop.m
factorial_loop(5)
factorial_loop(9)