User-defined function, MATLAB Programming

Assignment Help:

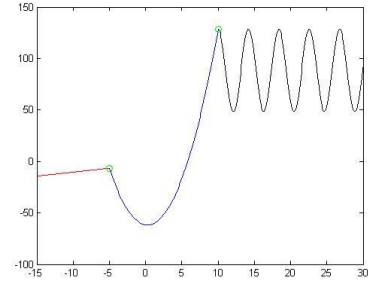
Your functions will allow you to create the following graph, which contains a piecewise function where a line exists in the first interval, a parabola in the second interval, and the sine function in the third interval. Notice that where each interval meets, points with an ‘o' marker are located. Each one of the 4 functions you create will plot something on a single figure.

Create a function called cs151f11assn5first. The purpose of this function is to plot the line of the first interval. This function has four input arguments (in this order): 

the x and y coordinates of a point on the line (matrix of two values: x and y)

the x and y coordinates of a point the line (matrix of two values: x and y)

a scalar of the beginning of the interval of the x-domain on the figure

a scalar of the end of the interval of the x-domain on the figure

This function does not return any values, meaning it has no output arguments.  This function will first calculate the slope of the line using the two points. To do this, calculate the change in y divided by the change in x, aka the rise over run equation.  You will also need to find the y-intercept. To do this, use the x and y values of one of the points and solve for b in the equation b mx y (remember, m is the slope you just calculated).  A vector of x-values will need to be created using the beginning and ending values of interval of the x-domain, with an increment of 0.1.  Then, create the y-values using the equation mx + b Finally, plot the line in red.

924_user-defined function.png


Related Discussions:- User-defined function

Create a function to generate a sinusoidal signal, Create a function using ...

Create a function using mat lab to generate a sinusoidal signal. The parameters of the signal should have an Amplitude = 100, frequency = 100Hz, initial phase = 0, sample rate = 50

Population pyramid, I want to write a function in matlab which gives me a p...

I want to write a function in matlab which gives me a population pyramid bar chart. could you please help me do this.

Random numbers, Random numbers: Whenever a program is being written to...

Random numbers: Whenever a program is being written to work with a data, and the data is not yet available, it is frequently useful to test the program first by initializing t

#GUI, #create a matlab GUI for designing common emitter amplifier which pro...

#create a matlab GUI for designing common emitter amplifier which produces AC load lines based on the component values

Create a model or spreadsheet in matlab, The pressure radiated by a column ...

The pressure radiated by a column of in-phase monopole sources may be expressed as: Create a model (spreadsheet / MATLAB etc) for a 6 element column, where d=0.2m . Figure

Rungakuta methord, the basic equation of modeling radioactive decay is wher...

the basic equation of modeling radioactive decay is where the amount of the radioactive substance is at time and is the decay rate. Some radioactive substances decay into other rad

Steady-state conduction equation, Problem: Consider a trapezoidal piece of...

Problem: Consider a trapezoidal piece of polymer film as shown below. The parallel sides of the trapezoid are insulated and the temperature of the bottom and diagonal sides are f

Find the volume if pyramid, Write a script to determine the volume of a pyr...

Write a script to determine the volume of a pyramid, which is 1/3 * base * height, where the base is length * width. On time the user to enter values for the length, width, and th

Write Your Message!

Captcha
Free Assignment Quote

Assured A++ Grade

Get guaranteed satisfaction & time on delivery in every assignment order you paid with us! We ensure premium quality solution document along with free turntin report!

All rights reserved! Copyrights ©2019-2020 ExpertsMind IT Educational Pvt Ltd