Gui for plotting functions, Computer Graphics

Assignment Help:

For this assignment you will write a GUI for plotting functions. The user will supply the de?nition of a function in the variable x, the range of x and y values to be plotted and the number of steps in the plot. The GUI will then display the function. The user can enter any number of functions. Each will be plotted in the chosen colour. The plot information can also be changed - i.e. the x and y ranges and the number of steps. All the functions can then be redrawn using the new setup.

One way to plot a function is to construct a sequence

< (x1, y1), (x2, y2), . . . , (xn, yn) >

where x1 is the smallest value of x, xn is the largest value of x, n is the number of steps, each yi is the result of applying the function to xi and all the xi are equally spaced. The lines from (xi, yi) to (xi+1, yi+1) are then drawn to produce an approximation to the function. The larger the number of steps, the better the approximation.

Typically though, the sequence is not really constructed. All that is needed is the pairs of adjacent points so that a line can be drawn between them. The assignment support ?le de?nes an iterator that generates the required sequence.

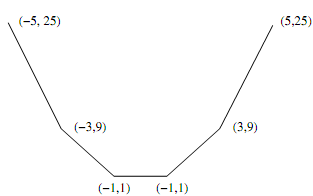
Below is an example of plotting the function x2 from -5 to 5 in 6 steps. First a line from (-5, 25) to (-3, 9) is drawn followed by the line from (-3, 9) to (-1, 1), followed by the line from (-1, 1) to (1, 1), followed by the line from (1, 1) to (3, 9), followed by the line from (3, 9) to (5, 25).

931_GUI for Plotting Functions.png

For the actual plotting you will be using a canvas widget. The canvas has a given width and height while the plotting parameters specify ranges for x and y. Therefore a conversion is required that map 'real world' coordinates (i.e. the x,y values) to screen (canvas) coordinates. Remember that in the 'real world' y values increase as you move up while on a canvas they decrease as you move up. The assignment support ?le de?nes a coordinates conversion class that does this job.

Assignment Tasks

For each class and method that you write you need to provide a suitable comment giving a description and where necessary the type and any preconditions. You should use the triple-quote commenting style.


Related Discussions:- Gui for plotting functions

Please give me ans, Differences between digital differential analyzer and ...

Differences between digital differential analyzer and VECGEN line algorithm?

Explain the term- control, Explain the term- Control Traffic lights (co...

Explain the term- Control Traffic lights (controlling the sequence of lights to maintain optimum traffic flow), chemical and nuclear plants (opening and closing valves, safety

Other curves - parabola and hyperbola, Other curves - parabola and hyperbol...

Other curves - parabola and hyperbola Conic sections such as parabola and hyperbola are used in many instances such as in motion planning along a trajectory or in modelling the

Microcomputer applications, Calculate how many customers there are for each...

Calculate how many customers there are for each lawn size. Name this sheet

Arguments made in favour of analog sound, Arguments made in favour of Analo...

Arguments made in favour of Analog Sound Shape of the waveforms: from digital signals sound reconstructed which is claimed to be harsher and unnatural compared to analog si

Overstriking, why overstriking is harmful.justify

why overstriking is harmful.justify

Animation, Animation, Video and Digital Movies : These are sequences of bi...

Animation, Video and Digital Movies : These are sequences of bitmapped graphic scenes or frames, quickly played back. But animations can also be made inside the authoring system t

Scientific visualization, Scientific Visualization This is complex for...

Scientific Visualization This is complex for the human brain to create sense out of the large volume of numbers produced through a scientific computation. Statistical and nume

Variation of intensity - modeling and rendering, Variation of Intensity - M...

Variation of Intensity - Modeling and Rendering According to the phong model the variation of Intensity (I) along with α (since I α cos n α) is: i) for shiny surface (

Write Your Message!

Captcha
Free Assignment Quote

Assured A++ Grade

Get guaranteed satisfaction & time on delivery in every assignment order you paid with us! We ensure premium quality solution document along with free turntin report!

All rights reserved! Copyrights ©2019-2020 ExpertsMind IT Educational Pvt Ltd