Text graphic function - graphics objects, MATLAB in Engineering

Assignment Help:

Text graphic function - Graphics objects:

The text graphic function permits text to be printed in a Figure Window, involving special characters which are printed by using \specchar, where specchar is the real name of the special character. The format of the call to text function is as shown below:

text(x,y,'text string')

where x & y are coordinates on the graph of the starting of the text box in which the text string appears.

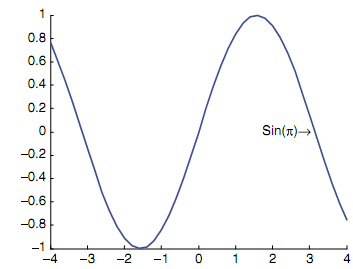
To see the options for special characters, under the Contents tab in Help, click the Handle Graphics Property Browser, then click Core Objects, and then select Text. The special characters are shown in a table under the String property. The special characters involve letters of the Greek alphabet, arrows, and characters often used in equations. For illustration, figure shows the Greek symbol for pi and a right arrow in the text box.

>> x = -4:0.2:4;

>> y = sin(x);

>> hp = line(x,y,'LineWidth',3);

>> thand = text(2,0,'Sin(\pi)\rightarrow')

25_Text graphic function - Graphics objects.png


Related Discussions:- Text graphic function - graphics objects

Ischar function - string, ischar function: The ischar function return ...

ischar function: The ischar function return the logical true if an array is a character array, or logical false if not. >> vec = 'EK127'; >> ischar(vec) ans =

Subfunctions, Subfunctions: Though, it is possible to have more than o...

Subfunctions: Though, it is possible to have more than one function in a given M-file. For illustration, if one function calls the other, the first function would be the prima

Technique to create nested structures, Technique to create Nested structure...

Technique to create Nested structures: This technique is the most proficient. Though, the other technique is to build the nested structure one field at a time. As this is a ne

Calling of function polyval, Calling of Function polyval: The curve do...

Calling of Function polyval: The curve does not appear very smooth on this plot, but that is as there are only five points in the x vector. To estimate the temperature

Variable scope, Variable Scope: The scope of any of variable is the wo...

Variable Scope: The scope of any of variable is the workspace in which it is valid. The workspace generated in the Command Window is known as the base workspace. As we know

Function issorted - set operations, Function issorted - set operations: ...

Function issorted - set operations: The function issorted will return 1 for logical true when the argument is sorted in ascending order (minimum to maximum), or 0 for false wh

Illustration of initializing the data structure, Illustration of initializi...

Illustration of initializing the data structure: illustration of initializing the data structure by preallocating is here as shown: >> cyls(3) = struct('code', 'c', 'dimen

Illustration of sorting strings, Illustration of Sorting strings: To s...

Illustration of Sorting strings: To sort on the rows rather than second dimension should be specified. >> sort(words,2) ans = Hello Hdowy Hi Gbdeo

Creating cell arrays, Creating Cell arrays: There are many ways to cre...

Creating Cell arrays: There are many ways to create cell arrays. For illustration, we will create a cell array in which one element will store an integer, one element store ch

Reduced row echelon form, Reduced Row Echelon Form: The Gauss Jordan t...

Reduced Row Echelon Form: The Gauss Jordan technique results in a diagonal form; for illustration, for a 3 × 3 system: The Reduced Row Echelon Forms take this one step

Write Your Message!

Captcha
Free Assignment Quote

Assured A++ Grade

Get guaranteed satisfaction & time on delivery in every assignment order you paid with us! We ensure premium quality solution document along with free turntin report!

All rights reserved! Copyrights ©2019-2020 ExpertsMind IT Educational Pvt Ltd