a. Objectives
- Observe vibration first hand
- Calculate natural frequency and damping coefficient
- observe changes as a result of temperature and material
b. Background
When skiing, any type of bump or variation in the surface of the ground causes vibration in the skis. These vibrations cause the ski to lose contact with the ground. Without proper contact, you lose the ability to turn or stop. A similar situation occurs when driving a car on a bumpy road. In a car, the shocks and struts reduce vibration. Skis rely on their shape and the material from which they are made to reduce these vibrations and provide more control to the skier.
Natural vibration frequency is largely a property of material and geometry. While certain geometries (shapes) or materials can reduce vibration, they may also adversely affect speed or increase friction. Manufacturers' effort to balance this 'give and take' can be seen in the variety of types of skis.
The damping coefficient of the skis also contributes to how quickly vibration is reduced after a bump. The higher the damping coefficient, the faster vibrations will be equalized, while lower damping coefficients would allow vibration to continue for a longer time. For example, if you flick a taut rubber band you will see the vibrations continue for minutes, but if you do the same with a show string the vibrations will be gone in seconds.
c. Concepts
Frequency:
- When a ski vibrates it has a frequency
- Units: number of cycles per unit time ( ie cycles/sec)
- SI units are Hertz (Hz)
- Period (P) is the length of one oscillation
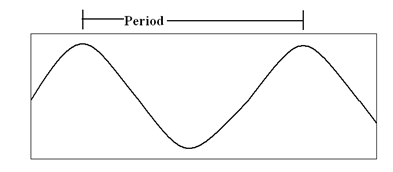
Fig 1 Period
Natural Frequency:
- Natural Frequency is the frequency in which an object settles into if it is not disturbed.
- Different for different materials and different geometries
- If an oscillating force is in sync with the natural frequency the oscillations start to build on each other and the oscillations continue to grow uncontrollably
- Natural frequency (f) is the reciprocal of the period so f=1/P
Damping Coefficient, c
- Damping Coefficient determines how damped a ski is or how long a ski will vibrate
- Units of mass per unit time
- If decaying curve, the equation of the line Y=A*e-c*x with c = damping coefficient. This is shown in Fig. 2 with the black line being the line represented by Y=A*e-c*x
- System can be
Underdamped (ξ < 1) Lots of oscillations
Rubber band
Critically damped (ξ = 1) No oscillations, but moves quickly
Car shocks
Overdamped (ξ > 1) No oscillations, but moves slowly
Door damper
- Equation relating spring constant and mass to damping coefficient
c= ξ*2*(k*m)(1/2)
k = spring constant, m = mass
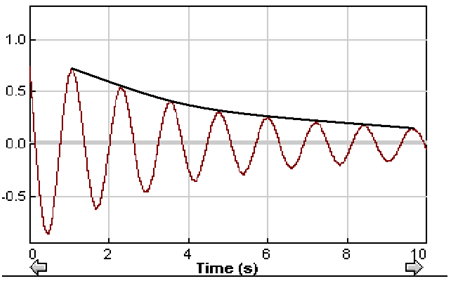
Figure 2
d. Procedure
As we ran the experiment in class as a demo you will simply download the data from the blackboard site under assignments. There will be four files. One for the SS ski at room temperature and near freezing as well as the composite ski at room temperature and near freezing.
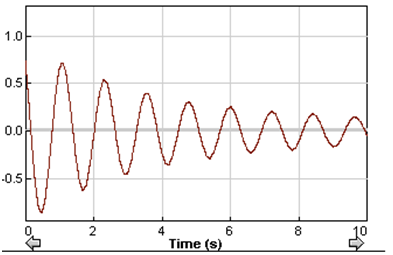
Figure : Decaying Wave
1. Open the downloaded Excel files. The left column represents the time in seconds while the right column is acceleration.
2. Create a graph by highlighting the entirety of the two columns buy highlighting the first values of both column and then hold down control and shift and press down.
a. On the top menu bar select "insert"; "chart"; "XY (Scatter)"; then select the icon on the right that shows smooth curves with no data points. Click finish and you have your chart with time on the x axis and acceleration on the y axis. Your data if when zoomed in should look something like figure 4.
3. Find the time for one period of vibration; one period is shown in Figure 5.
a. By hovering the mouse curser over the graph the x,y values will be displayed. To find the period, record the time values for two consecutive peaks and subtract those values
P = X1- X2 =____________
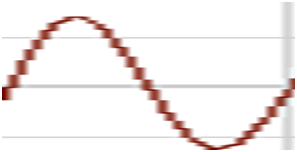
Figure : One period of vibration
4. The natural frequency can then be found by taking the reciprocal of the period.
f = 1/P = 1/seconds = Hertz
Frequency = 1/time (number of seconds in one period) Record your frequency.
5. The damping coefficient will be found by looking at the maximum points of the graph
a. By hovering over a peak point on the graph the x,y values will be displayed
b. Record about 10 different peak values into excel, start with the highest peak before it starts to decay and end when the peaks start to level off.
c. Input these values into excel and make another 'XY (Scatter)' graph exactly the same way as in step 2.
d. After the graph is created, click on the data in the graph, highlighting the data
e. Right click and select 'Add Trend line'
f. Under 'Type' select exponential
g. Under 'Options' select 'Display Equation on Chart'
h. Click 'OK'
i. This will fit an exponential curve to the data you selected and an equation such as Y= A*eB*x
j. The 'B' value is the damping coefficient. Record this for later use
6. Repeat for all four files.
7. Using the recorded values answer the questions asked in the homework assignment.