Reference no: EM132269435
Bio-Statistics and Epidemiology Assignment -
Instructions - In a Word document, answer the review questions at the end of Chapters 4 and 6 in Gordis, using Week 3: Statistical Exercises (Excel). Provide a brief rationale for each response.
Textbook - Epidemiology, 5th Edition, Authors: Leon Gordis.
SECTION I - The Epidemiologic Approach to Disease and Intervention
CHAPTER 4 - The Occurrence of Disease: II. Mortality and Other Measures of Disease Impact
CHAPTER 6 - The Natural History of Disease: Ways of Expressing Prognosis
Chapter 4 Review Questions -
Questions 1 and 2 are based on the information given below:
In an Asian country with a population of 6 million people, 60,000 deaths occurred during the year ending December 31, 2010. These included 30,000 deaths from cholera in 100,000 people who were sick with cholera.
Q1. What was the cause-specific mortality rate from cholera in 2010?
Q2. What was the case-fatality from cholera in 2010?
Q3. Age-adjusted death rates are used to:
a. Correct death rates for errors in the statement of age.
b. Determine the actual number of deaths that occurred in specific age groups in a population.
c. Correct death rates for missing age information.
d. Compare deaths in persons of the same age group.
e. Eliminate the effects of differences in the age distributions of populations in comparing death rates.
Q4. The mortality rate from disease X in city A is 75/100,000 in persons 65 to 69 years old. The mortality rate from the same disease in city B is 150/100,000 in persons 65 to 69 years old. The inference that disease X is two times more prevalent in persons 65 to 69 years old in city B than it is in persons 65 to 69 years old in city A is:
a. Correct.
b. Incorrect, because of failure to distinguish between prevalence and mortality.
c. Incorrect, because of failure to adjust for differences in age distributions.
d. Incorrect, because of failure to distinguish between period and point prevalence.
e. Incorrect, because a proportion is used when a rate is required to support the inference.
Q5. The incidence rate of a disease is five times greater in women than in men, but the prevalence rates show no sex difference. The best explanation is that:
a. The crude all-cause mortality rate is greater in women.
b. The case-fatality from this disease is greater in women.
c. The case-fatality from this disease is lower in women.
d. The duration of this disease is shorter in men.
e. Risk factors for the disease are more common in women.
Q6. For a disease such as pancreatic cancer, which is highly fatal and of short duration:
a. Incidence rates and mortality rates will be similar.
b. Mortality rates will be much higher than incidence rates.
c. Incidence rates will be much higher than mortality rates.
d. Incidence rates will be unrelated to mortality rates.
e. None of the above.
Q7. In 1990, there were 4,500 deaths due to lung diseases in miners aged 20 to 64 years. The expected number of deaths in this occupational group, based on age-specific death rates from lung diseases in all males aged 20 to 64 years, was 1,800 during 1990. What was the standardized mortality ratio (SMR) for lung diseases in miners?
Question 8 is based on the information given below:
|
Annual Cancer Deaths in White Male Workers in Two Industries
|
|
Cancer Site
|
INDUSTRY A
|
INDUSTRY B
|
|
No. of Deaths
|
% of All Cancer Deaths
|
No. of Deaths
|
% of All Cancer Deaths
|
|
Respiratory system
|
180
|
33
|
248
|
45
|
|
Digestive system
|
160
|
29
|
160
|
29
|
|
Genitourinary
|
80
|
15
|
82
|
15
|
|
All other sites
|
130
|
23
|
60
|
11
|
|
Totals
|
550
|
100
|
550
|
100
|
Based on the preceding information, it was concluded that workers in industry B are at higher risk of death from respiratory system cancer than workers in industry A. (Assume that the age distributions of the workers in the two industries are nearly identical.)
Q8. Which of the following statements is true?
a. The conclusion reached is correct.
b. The conclusion reached may be incorrect because proportionate mortality rates were used when age-specific mortality rates were needed.
c. The conclusion reached may be incorrect because there was no comparison group.
d. The conclusion reached may be incorrect because proportionate mortality was used when cause-specific mortality rates were needed.
e. None of the above.
Q9. A program manager from an international health funding agency needs to identify regions that would benefit from an intervention aimed at reducing premature disability. The program manager asks a health care consultant to develop a proposal using an index that would help her make this decision. Which of the following would best serve this purpose?
a. Case-fatality.
b. Crude mortality rate.
c. Disability-adjusted life-years.
d. Standardized mortality ratio.
Q10. The following are standardized mortality ratios (SMRs) for lung cancer in England:
|
Occupation
|
Standardized mortality ratios
|
|
1949-1960
|
1968-1979
|
|
Carpenters
|
209
|
135
|
|
Bricklayers
|
142
|
118
|
Based on these SMRs alone, it is possible to conclude that:
a. The number of deaths from lung cancer in carpenters in 1949-1960 was greater than the number of deaths from lung cancer in bricklayers during the same period.
b. The proportionate mortality from lung cancer in bricklayers in 1949-1960 was greater than the proportionate mortality from lung cancer in the same occupational group in 1968-1979.
c. The age-adjusted rate of death from lung cancer in bricklayers was greater in 1949- 1960 than it was in 1968 1979.
d. The rate of death from lung cancer in carpenters in 1968-1979 was greater than would have been expected for a group of men of similar ages in all occupations.
e. The proportionate mortality rate from lung cancer in carpenters in 1968-1979 was 1.35 times greater than would have been expected for a group of men of similar ages in all occupations.
Questions 11 and 12 are based on the information given below:
|
Numbers of People and Deaths from Disease Z by Age Group in Communities X and Y
|
|
Age Group
|
COMMUNITY X
|
COMMUNITY Y
|
|
No. of People
|
No. of Deaths from Disease Z
|
No. of People
|
No. of Deaths from Disease Z
|
|
Young
|
8,000
|
69
|
5,000
|
48
|
|
Old
|
11,000
|
115
|
3,000
|
60
|
Calculate the age-adjusted death rate for disease Z in communities X and Y by the direct method, using the total of both communities as the standard population.
Q11. The age-adjusted death rate from disease Z for community X is: ______.
Q12. The proportionate mortality from disease Z for community Y is: ________.
a. 9.6/1,000.
b. 13.5/1,000.
c. 20.0/1,000.
d. 10.8/1,000.
e. None of the above.
Chapter 6 Review Questions -
Question 1 is based on the information given in table below:
|
Year of Treatment
|
No. of Patients Treated
|
NO. OF PATIENTS ALIVE ON EACH ANNIVERSARY OF BEGINNING TREATMENT
|
|
1st
|
2nd
|
3rd
|
|
2007
|
75
|
60
|
56
|
48
|
|
2009
|
63
|
55
|
31
|
|
|
2010
|
42
|
37
|
|
|
|
Total
|
180
|
150
|
87
|
48
|
One hundred eighty patients were treated for disease X from 2007 to 2009, and their progress was followed to 2010. The treatment results are given in the table. No patients were lost to follow-up.
Q1. What is the probability of surviving for 3 years?
Q2. An important assumption in this type of analysis is that:
a. Treatment has improved during the period of the study.
b. The quality of record-keeping has improved during the period of the study.
c. No change has occurred in the effectiveness of the treatment during the period of the study.
d. An equal number of men and women were enrolled each year.
e. None of the above.
Q3. Which of the following is a good index of the severity of a short-term, acute disease?
a. Cause-specific death rate.
b. 5-year survival.
c. Case-fatality.
d. Standardized mortality ratio.
e. None of the above.
Q4. A diagnostic test has been introduced that will detect a certain disease 1 year earlier than it is usually detected. Which of the following is most likely to happen to the disease within the 10 years after the test is introduced? (Assume that early detection has no effect on the natural history of the disease. Also assume that no changes in death certification practices occur during the 10 years.)
a. The period prevalence rate will decrease.
b. The apparent 5-year survival will increase.
c. The age-adjusted mortality rate will decrease.
d. The age-adjusted mortality rate will increase.
e. The incidence rate will decrease.
Q5. Which of the following statements about relative survival is true?
a. It refers to survival of first-degree relatives.
b. It is generally closer to observed survival in elderly populations.
c. It is generally closer to observed survival in young populations.
d. It generally differs from observed survival by a constant amount, regardless of age.
e. None of the above.
Questions 6 to 8 are based on the data in the table below. The data were obtained from a study of 248 patients with Al DS who were given a new treatment and followed to determine survival. The study population was followed for 36 months.
Note: Carry your calculations in the table to four decimal places (i.e., 0.1234), but give the final answer to three decimal places (e.g., 0.123 or 123%).
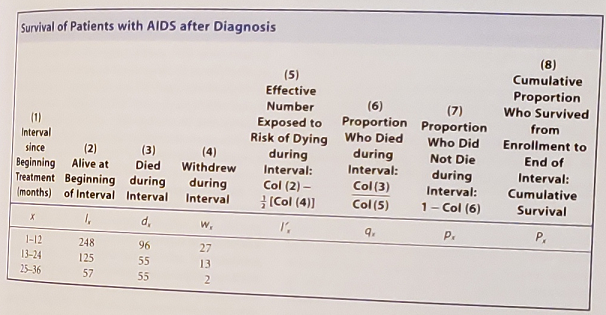
Q6. For those people who survived the second year, what is the probability of dying in the third year?
Q7. What is the probability that a person enrolled in the study will survive to the end of the third year?
Q8. Before reporting the results of this survival analysis, the investigators compared the baseline characteristics of the 42 persons who withdrew from the study before its end with those of the participants who had complete follow-up. This was done for which of the following reasons:
a. To test whether randomization was successful.
b. To check for changes in prognosis over time.
c. To check whether those who remained in the study represent the total study population.
d. To determine whether the outcome of those who remained in the study is the same as the outcome of the underlying population.
e. To check for confounders in the exposed and non-exposed groups.
Attachment:- Bio-Statistics and Epidemiology Assignment.rar