Reference no: EM131394508
Consider again the Pew Research Center results on age and political party in given Exercise.
a) What is the marginal distribution of party affiliation?
b) Create segmented bar graphs displaying the conditional distribution of party affiliation for each age group.
c) Summarize these poll results in a few sentences that might appear in a newspaper article about party affiliation in the United States.
d) Do you think party affiliation is independent of the voter's age? Explain.
Exercise:
Age and party 2007. The Pew Research Center conducts surveys regularly asking respondents which political party they identify with. Among their results is the following table relating preferred political party and age. (https://people-press.org/reports/)
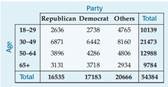
a) What percent of people surveyed were Republicans?
b) Do you think this might be a reasonable estimate of the percentage of all voters who are Republicans? Explain.
c) What percent of people surveyed were under 30 or over 65?
d) What percent of people were classified as "Other" and under the age of 30?
e) What percent of the people classified as "Other" were under 30?
f) What percent of people under 30 were classified as "Other"?
|
What costs may be incurred by healthcare organizations
: What are the hospital and physician incentives for healthcare organizations as defined by ARRA? What costs may be incurred by healthcare organizations through the implementation of HIT?
|
|
Find mean and standard deviation of the assembly time model
: One way the company could solve this problem would be to change the advertising claim. What assembly time should the company quote in order that 60% of customers succeed in finishing the desk by then?
|
|
Display given results in a bar graph
: How could the number of people who do not know who Martha Stewart is increase from June to July? Did people forget her? Or is the poll perhaps flawed? Explain how these results could be valid.
|
|
Identify new entrant or product that brings new competition
: Research and select an industry that you have not analyzed previously in this course. Within this industry, you should be able to identify a new entrant or product that brings new competition to the market because of emerging trends or changing tr..
|
|
What percent of people surveyed were republicans
: What percent of people surveyed were Republicans?- Do you think this might be a reasonable estimate of the percentage of all voters who are Republicans? Explain.
|
|
Discuss how the route of exposure can affect the toxicity
: Describe how toxicant absorption is limited for inhalation, absorption, and ingestion. Use an example of any drug or chemical, discuss how the route of exposure can affect the toxicity.
|
|
Compute the electron diffusion coefficient
: Compute the electron diffusion coefficient in m2s-1 assuming that (σV), averaged over the electron velocity distribution, is just equal to σVe, where Ve is the velocity the electrons would have if accelerated to a kinetic energy of 2 eV
|
|
What percent of people surveyed were republicans
: What percent of people surveyed were Republicans?- Do you think this might be a reasonable estimate of the percentage of all voters who are Republicans? Explain.
|
|
Are wage distributions likely to be symmetric or skewed left
: By contrast, for General and Operations Managers, the mean hourly wage was $47.73 and the median was $40.97. Are these wage distributions likely to be symmetric, skewed left, or skewed right? Explain.
|