Reference no: EM131381246
STATISTICAL APPLICATIONS FOR TECHNOLOGY HOMEWORK
PART 1 - STATISTICAL APPLICATIONS FOR TECHNOLOGY ANALYSIS ASSIGNMENT QUESTIONS
1. In an unbiased coin toss, the probability of getting heads or tails is exactly ½. A coin is tossed And one gets heads. What is the probability of getting heads if the coin is tossed again?
2. A bag contains 4 red balls, 3 green balls and 5 blue balls. What is the probability of not getting a red ball in the first draw?
3. How many ways can you invite one or more of five friends to a party?
4. Box A has 4 white balls, 3 blue balls, and 3 orange balls. Box B has 2 white balls, 4 blue balls, and 4 orange balls. If one ball is drawn from each box, what is the probability that one of the Two balls will be orange?
5. The average number of customers served at a post office is 20 per hour. What is the Probability that exactly 8 customers will be served in the next hour?
6. Five fair coins are each flipped once. What is the probability that at least two coins will show Heads?
7. What is the standard deviation of 1, 4, and 7?
8. Seven measurements are taken: 4.31, 4.39, 4.38, 4.33, 4.36, 4.32, and 4.37. What is the sample Standard deviation?
9. What is a possible outcome of an experiment called?
(A) a sample space
(B) a random point
(C) an event
(D) a finite set
(E) a discrete set
10. In probability theory, what is the set of all possible outcomes of an experiment called?
(A) a set of random events
(B) a fuzzy set
(C) a cumulative distribution
(D) a sample space
(E) a set of random variables
11. How can the values of a random variable defined over a sample space be described?
(A) always continuous
(B) always numerical
(C) strictly nonzero
(D) defined only over a finite horizon
(E) always mutually exclusive of other sample spaces
12. If two random variables are independently distributed, what is their relationship?
(A) They are not identically distributed.
(B) They are uncorrelated.
(C) They are mutually exclusive.
(D) (A) or (B)
(E) (A) or (B) or (C)
13. Which of the following properties of probability is not valid?
(A) The probability of an event is always positive and less than one.
(B) If E0 is an event which cannot occur in the sample space, the probability of E0 is zero.
(C) If events E1 and E2 are mutually exclusively, then the probability of both events occurring is zero.
(D) If events E1 and E2 are mutually exclusive, then P (E1 + E2) = P (E1) + P (E2) - P (E1E2).
(E) The expected value of a discrete distribution of random variables does not have to be one of the distribution's values.
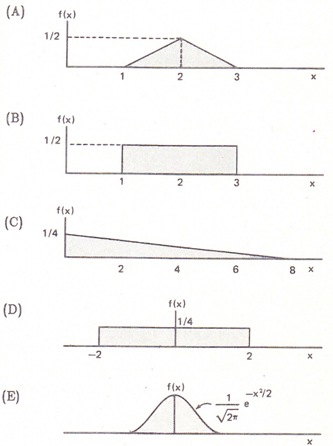
14. Which one of the following functions cannot be a probability density function for the Variable x?
15. If n is the number of trials and m is the number of successes, what is the frequency based Interpretation of the probability of event E?
(A) P(E) = limn→∞ n-m/n
(B) P(E) = limn→∞ n/m
(C) P(E) = limn→∞ m/m-n
(D) P(E) = limn→∞ m/n
(E) P(E) = limn→∞ n/m-n
16. For a continuous random variable X with probability density function f(x), what is the Expected value of X?
(A) E(X) = 0∫∞ xf(x) dx
(B) E(X) = -∞∫∞ xf(x) dx
(C) E(X) = 0∫∞ f(x) dx
(D) E(X) = 0∫∞ x dx
(E) E(X) = 0∫∞ (x-x-)f(x) dx
17. If P ≠ 1, and A and B are not independent events, what is P (A|B)?
(A) P(A) × P(B)
(B) P(B|A) × P(A) ÷ P(B)
(C) P(A)
(D) P(A|B) × P(B) ÷ P(A)
(E) P(A) ÷ P(B)
18. If the discrete random variable X has a geometric distribution parameter P and smallest mass Point O, what is the expected value of X?
(A) P
(B) P-1
(C) P1-P
(D) (1-P)/P
(E) P2
19. If the variable X has a Poisson distribution with parameter λ, what is the expected value of X?
(A) λ2
(B) λ(1 - λ)
(C) λ-1
(D) (λk-λ)/k!
(E) λ
20. If X is a binomial random variable with parameters n and p, what is the expected value of X?
(A) n(1 - p)
(B) np(1 - p)
(C) p-1
(D) np
(E) n
21. For a discrete random variable X with probability mass function P(X), what is the expected Value of X?
(A) E(X) = ∑all x_i xiP(xi)
(B) E(X) = ∑all x_i xi2P(xi)
(C) E(X) = ∑all x_i P(xi)
(D) E(X) = ∑all x_i (xi-x-)P(xi)
(E) E(X) = ∑all x_i (P(xi))2
22. An item's cost distribution is given as a function of the probability. What is the expected Cost?
|
Cost
|
probability
|
|
1
|
0.07
|
|
2
|
0.23
|
|
3
|
0.46
|
|
4
|
0.17
|
|
5
|
0.04
|
|
6
|
0.03
|
(A) 2.5
(B) 2.9
(C) 3.0
(D) 3.1
(E) 3.4
23. In a dice game, one fair die is used. The player wins $10 if he rolls either a 1 or a 6. He loses $5 if he turns up any other face. What is the expected winning for one roll of the die?
(A) $0
(B) $3.33
(C) $5.00
(D) $6.67
(E) $10.00
24. An urn contains four black balls and six white balls. What is the probability of getting one Black ball and one white ball in two consecutive draws from the urn?
(A) 0.04
(B) 0.24
(C) 0.27
(D) 0.48
(E) 0.53
25. The probability that both stages of a two-stage rocket will function correctly is 0.95, the Reliability of the first stage is 0.98. What is the reliability of the second stage?
(A) 0.95
(B) 0.96
(C) 0.97
(D) 0.98
(E) 0.99
PART 2 - STATISTICAL APPLICATIONS FOR TECHNOLOGY ANALYSIS ASSIGNMENT
1. Calculate the mean, standard deviation, sample standard deviation, variance, and sample Variance of the following set of numbers: 3, 4, 4, 5, 8, 8, 8, 10, 11, 15, 18, and 20.
2. The values of x and their corresponding values of y are shown in the table below.
a) Find the least square regression line y = ax + b.
b) Estimate the value of y when x = 10.
3. The sales of a company (in million dollars) for each year are shown in the table below.
|
x(year)
|
2005
|
2006
|
2007
|
2008
|
2009
|
|
y(sales)
|
12
|
19
|
29
|
37
|
45
|
a) Find the least square regression line y = ax + b.
b) Use the least squares regression line as a model to estimate the sales of the company in 2012.
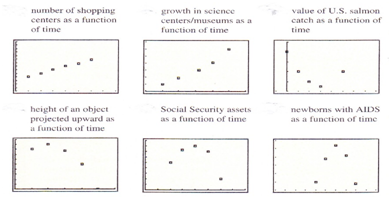
4. In each scatter diagram, tell whether a linear or quadratic model is appropriate for the data. If Linear, tell whether the slope should be positive or negative. If quadratic, tell whether the Leading coefficient of x2 should be positive or negative.
PART 3 - STATISTICAL APPLICATIONS FOR TECHNOLOGY ANALYSIS ASSIGNMENT
1. The Chi-Square Test
Jury Selection (adapted from the Freedman, Pisani, and Purves classic text)
One study of grand juries in Alameda County, California, compared the demographic characteristics of jurors with the general population, to see if jury panels were representative. The results for age are shown below. The investigators wanted to know if the 66 jurors were selected at random from the population of Alameda County. (Only persons over 21 and over are considered; the county age distribution is known from Public Health Department data.) The study was published in the UCLA Law Review.
|
Age
|
Count-wide %
|
# of jurors observed
|
# of jurors expected
|
(O-E)
|
(O-E)2/E
|
|
21-40
|
42%
|
5
|
|
|
|
|
41-50
|
23%
|
9
|
|
|
|
|
51-60
|
16%
|
19
|
|
|
|
|
over 60
|
19%
|
33
|
|
|
|
|
Total
|
100%
|
66
|
|
|
|
a) Should you do a test of homogeneity or a test of independence? Why?
b) Do we have evidence that grand juries are selected at random for the population of Alameda County?
2. Use MATLAB to generate a linear (1st Order) approximation for the population in the USA From 1986 to 2005.
3. Use MATLAB to generate a quadratic (2nd Order) approximation for the population in the USA from 1986 to 2005.
Population in the United States of America from 1986 to 2005.
|
Year
|
Population
|
|
1986
|
240,132,887
|
|
1987
|
242,288,918
|
|
1988
|
244,498,982
|
|
1989
|
246,819,230
|
|
1990
|
249,464,396
|
|
1991
|
252,153,092
|
|
1992
|
255,029,699
|
|
1993
|
257,782,608
|
|
1994
|
260,327,021
|
|
1995
|
262,803,276
|
|
1996
|
265,228,572
|
|
1997
|
267,783,607
|
|
1998
|
270,248,003
|
|
1999
|
272,690,813
|
|
2000
|
281,421,906
|
|
2001
|
285,317,559
|
|
2002
|
287,973,924
|
|
2003
|
290,788,976
|
|
2004
|
293,656,842
|
|
2005
|
296,410,404
|
PART 4 - STATISTICAL APPLICATIONS FOR TECHNOLOGY PROJECT
Pick one of the datasets on the CD-ROM that came with the new copy of the textbook. Data files are available in ASCII, Excel, Minitab, JMP, SAS, SPSS, and S-Plus formats. Alternatively, you can use any of the datasets of the PowerPoint presentations or Reading Materials. You must state in your project where your dataset came from. However, in either case make sure that the data is curvilinear and suitable for multiple regressions.
1) Create a multiple regression model.
2) Formulate a null and alternative hypotheses.
3) Identify and explain the test statistic that will be used.
4) Run the Multiple Regression Software Tool to fully analyze the data and report its results.
5) Reject or do not reject your null hypotheses and explain why.
6) Accept or do not accept your alternative hypothesis.
7) Explain why your model is the best fit for the data.