What is probability that either of the company shows profit

Assignment Help Basic Statistics
Reference no: EM13905917

Part -1:

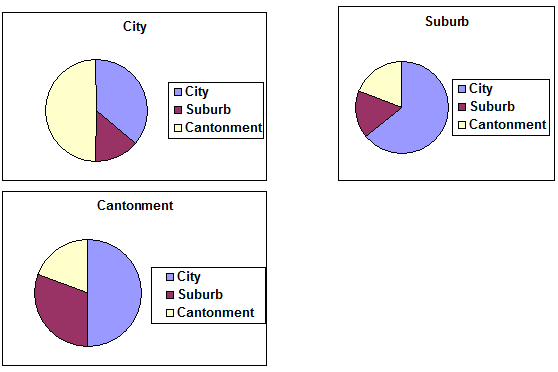
Case 1. A survey was conducted among the residents of Pune City, its suburbs and the Pune Cantonment area. The following three pie diagrams show their respective preferences for living in City, Suburb and cantonment.

489_Prepare appropriate frequency distribution.png

Case 2.

Suppose you are doing market research for a company that sells automotive accessories. You are interested in the types of cars driven by customers of a particular mall. On one particular day, you count the following types of cars in the lot:

------------------------------------------------------------------------------------------------------

Family car                   Economy car               Economy car               Utility van

Family car                   Wagon                         Wagon                         Wagon

Sports car                    Economy car               Utility van                   Family car

Pickup truck                Utility van                   Sports car                    Utility van

Wagon                         Wagon                         Wagon                         Family car

Pickup truck                Utility van                   Sports car                    Utility van

Economy car               Economy car               Utility van                   Sports car

Utility van                   Sports car                   

-----------------------------------------------------------------------------------------------------

Questions:

1. Do you see similar preference distribution in the three groups of residents in Case Study 1? ?

2. In Case Study 1,Which residents are most happy about where they are actually living? Explain

3. In Case Study 1, Which residents are the least happy about where they are actually living? Explain

4. In Case Study 2, Prepare appropriate frequency distribution

5. In Case Study 2, Represent above data by suitable graph

Part -2:

1576_Prepare frequency distribution.png

Questions

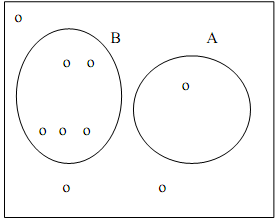
1. In the above Venn diagram the nine sample points shown are equally likely.

State following probabilities:

P(A), P(B), P(A ∪ B)

2. In the above Venn diagram the nine sample points shown are equally likely.

Are A and B mutually exclusive and exhaustive? Justify your answer.

3. A financial record of two companies A and B are examined to determine whether each company showed a profit (P) or not (N) during the last financial year. Is this a random experiment? Justify your answer.

4. A financial record of two companies A and B are examined to determine whether each company showed a profit (P) or not (N) during the last financial year. List the simple events associated with this experiment.

5. A financial record of two companies A and B are examined to determine whether each company showed a profit (P) or not (N) during the last financial year.Suppose P(A shows profit) = 0.8 and P(B shows profit) = 0.2, what is the probability that either of the company shows profit.?

Reference no: EM13905917

Questions Cloud

Prepare a report on jubliee cotton mills case : Prepare a report on Jubliee cotton mills case
Determine shaunas taxable income : Determine Shauna's taxable income and complete page 2 of Form 1040 (through taxable income, line 43) and Schedule A assuming her AGI is $107,000.
Functionality in the application : When the application starts, it should display a message asking the user to enter either option d or v. The application should execute the following actions for the two options: d: The application should display the file extension of the stock det..
What are the responsibilities of the research provider : As you can easily tell, ethics is a major component in the world of marketing research. What are the responsibilities of the 1) research provider and 2) research user, ie, the marketing manager?
What is probability that either of the company shows profit : What is the probability that either of the company shows profit - Which residents are most happy about where they are actually living? Explain
Desired file information viewer application : Therefore, she asks Hayley to modify the application to accept the name of a folder and display the following details of the files located in the folder: File name File size File creation date Write the code that Hayley should write to create the d..
Where do you think our creative intelligence types come from : When working in a group is it better to have members all of the same type or is it better to mix the creative intelligence types?
Complete pages one and two of form and schedule a : Please calculate my taxable income and complete pages 1 and 2 of Form 1040 (through taxable income, line 43) and Schedule A. You're still doing this for free, right?
What are philosophical implications : What are the philosophical implications for a reality based upon Einstein's concept of a four dimensional universe with a space-time continuum?

Reviews

Write a Review

Basic Statistics Questions & Answers

  Compute the standard error of the estimate of the data

compute the standard error of the estimate of the data below.x values 41 55 61 68 82y values

  Application of the corridor approach

XTRA Inc. has beginning-of-the-year present values for its projected benefit obligation and market-related values for its pension plan assets.

  Calculate correlations among the portfolio

Use data visualization techniques (graphical plotting) to see what the data will tell you - calculate correlations among the portfolio, SH, and RWM.

  Probability that percentage of scores less than hundred

Assume that a set of test scores is normally distributed with a mean of 100 and a standard deviation of 20. Use the 68-95-99.7 rule to find the following quantities.

  Null hypothesis interpretation of the p-value

The null hypothesis is the alternative is Use the given sample data to find out the P-value for the hypothesis test. Provide an interpretation of the P-value.

  The proportion of left-handed people in the general

the proportion of left-handed people in the general population is about 0.1. suppose a random sample of 225 people is

  According to the mendelian theory of inherited

according to the mendelian theory of inherited charateristics a cross ferilizatiopn of related species of red and white

  Construct a payoff matrix for johns problem if john were to

john carpenter runs a timber company. john is considering an expansion to his product line by manufacturing a new

  Least squares for fitting trends in an annual time series

If you are using the method of least squares for fitting trends in an annual time series containing 25 consecutive yearly values.

  Exploratory data analysis

Exploratory Data Analysis.

  A sample of 66 women over the age of 50 used the new cream

a sample of 66 women over the age of 50 used the new cream for 6 months. of those 66 women 30 of them reported skin

  How fast car have been going before its brakes were applied

Car A is known to have a maximum deceleration of 9.35 m/s2. How fast must car A have been going before its brakes were applied? Answer 97.5 km/h (27.1 m/s).

Free Assignment Quote

Assured A++ Grade

Get guaranteed satisfaction & time on delivery in every assignment order you paid with us! We ensure premium quality solution document along with free turntin report!

All rights reserved! Copyrights ©2019-2020 ExpertsMind IT Educational Pvt Ltd