Reference no: EM131164703
1. Allen Machines specializes in developing weed-harvesting equipment that is used to clear small lakes of weeds. Allen Machines is contemplating the construction of a machine that would harvest weeds on narrow rivers and waterways. The activities and time in weeks necessary to build one of these experimental machines are shown in the table below.
|
Activity
|
Immediate Predecessors
|
Time in Weeks
|
|
A
|
none
|
4
|
|
B
|
A
|
3
|
|
C
|
B
|
2
|
|
D
|
A
|
4
|
|
E
|
A
|
2
|
|
F
|
E
|
2
|
|
G
|
B, C
|
2
|
|
H
|
D,F
|
1
|
1. What is the minimum possible time required for completing the project?
2. What is the latest possible time that Activity E may be started without delaying the completion of the project?
3. What is the latest finish time for Activity H?
4. What is/are the critical path(s)?
Q2. The following is the activity and associated costs for the renovation of the local high school football stadium. The times are in weeks.
|
Activity
|
Immediate Predecessor
|
Time
|
Cost ($)
|
|
A
|
-
|
8
|
20,000
|
|
B
|
-
|
4
|
12,000
|
|
C
|
A
|
6
|
15,000
|
|
D
|
B
|
2
|
15,000
|
|
E
|
B
|
3
|
10,000
|
|
F
|
C, D
|
7
|
50,000
|
|
G
|
C, D
|
5
|
35,000
|
|
H
|
E, F
|
1
|
1,000
|
1. What is the critical path and total time required for this project?
2. How much of the total (cumulative) budget would be spent in Week 8 (Period 8) with the earliest start budget?
Q3. Precision Manufacturing has a government contract to produce stainless steel rods for use in military aircrafts. Each rod is required to be 35 millimeters in diameter. Each hour, random samples of size n = 5 rods are measured to check process control. Four hours of observations yielded the following:
Explanation: You are looking at the control limits for the variable, average diameter. You can use Excel QM or QM for Windows->Quality Control->x-bar and r-charts.
|
|
Diameter
|
|
Time
|
Rod 1
|
Rod 2
|
Rod 3
|
Rod 4
|
Rod 5
|
|
9 A.M.
|
34.5
|
34.9
|
37.9
|
36
|
35.9
|
|
10 A.M.
|
35.1
|
34.7
|
33
|
35.4
|
34.9
|
|
11 A.M.
|
38.9
|
35
|
37.9
|
38.3
|
36.5
|
|
Noon
|
25
|
35.2
|
32.1
|
38.1
|
35
|
1. Construct the xbar-chart and the R-chart.
2. Is the process in control?
Q4. Modern Electronics specializes in manufacturing modern electronic components. It also builds the equipment that produces the components. Modern Electronics is considering building a new facility but the estimated profits would be impacted by the type of market that develops. The probability for a strong market is 0.3; for a fair market is 0.3; and for a poor market is 0.4. You are responsible for advising the president of Modern Electronics on the type facility that should be built or to not build a facility at all. The table shows the estimated profits under each market and for each size facility.
Explanation: You can use QM for Windows->Decision Analysis->Decision Table with the above information.
|
|
Estimated Profits
|
|
|
Strong Market
|
Fair Market
|
Poor Market
|
|
Build a large facility
|
30,000
|
25,000
|
-20,000
|
|
Build a medium-size facility
|
27,500
|
25,000
|
-10,000
|
|
Build a small facility
|
15,000
|
12,500
|
-1000
|
|
Do not build a facility
|
0
|
0
|
0
|
1. What is your recommendation to the president based on expected value that maximizes profits (EMV).
2. Provide a second recommendation to the president that minimizes regret.
Q5. Consulting income at Kaplan Associates for the period February - July is shown in the table below. Assume that the initial forecast for February is $90,000.Use Exponential smoothing to forecast August's income.
Explanation: You can use Excel QM-Forecasting-Exponential with the above information.
|
Month
|
Income ($1,000)
|
|
February
|
90.0
|
|
March
|
88.5
|
|
April
|
74.8
|
|
May
|
91.7
|
|
June
|
91.3
|
|
July
|
92.8
|
1. Use a smoothing constant of α = 0.1.
2. Use a smoothing constant of α = 0.6.
3. Analysis of the forecasting errors indicates which forecasting constant is best in this situation?
Q6. Johnson Construction Company is in the process of installing power lines to a large housing development. The company wants to minimize the total length of wire used, which would minimize the company's cost. The housing development is shown below. Each house has been numbered, and the distances between houses are given in hundreds of feet.
Explanation: We want to create the minimum spanning tree (MST) for this network since all houses need to be connected. You can use QM for Windows to do this.
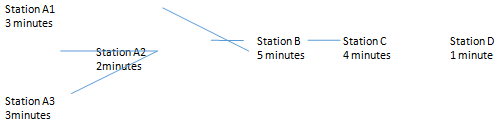
1. What do you recommend to Johnson Construction Company?
Q7. The storm drains in the Cedar Rapids, Iowa, have been upgraded following the devastating floods of 2008. The network of storm drains and the capacities are shown below. Determine the maximum flow (in hundreds of gallons of water per minute) from node 1 to node 5. Remember that the arc has both capacity and reverse capacity.
Explanation: You can use QM for Windows-Networks-Maximal Flow with the above information.
|
From Node
|
To Node
|
Fluid Flow
|
|
1
|
2
|
125
|
|
2
|
1
|
100
|
|
1
|
3
|
250
|
|
3
|
1
|
100
|
|
1
|
4
|
250
|
|
4
|
1
|
450
|
|
1
|
5
|
200
|
|
5
|
1
|
75
|
|
2
|
4
|
100
|
|
4
|
2
|
300
|
|
3
|
4
|
150
|
|
4
|
3
|
250
|
|
3
|
5
|
190
|
|
5
|
3
|
400
|
|
4
|
5
|
50
|
|
5
|
4
|
100
|
Q8. From the States Data Setthe following output for Collegeand for the Bachelors was created.
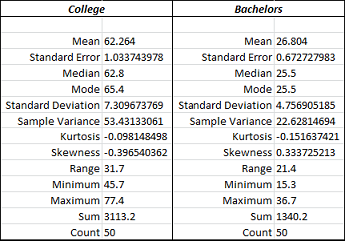
1. Which variable has the greatest relative variation?
Q9. You are a consultant working for Kaplan Consulting. The U.S. Department of Laborhas requested assistance in evaluating the impact of economic stimulus on the unemployment rate. From theStates Data Setthe following t test was conducted to answer the question:
"Has there been a significant reduction in the national unemployment rate between January and March?"
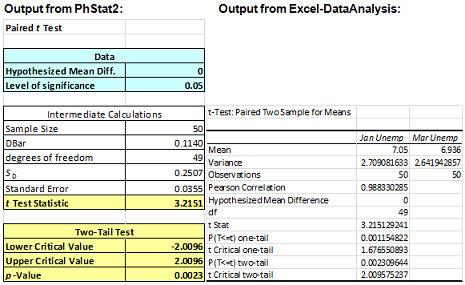
1. What is the Null and the Alternative Hypotheses?
2. What is your level of alpha (α)?
3. What is your decision about the hypothesis based on the software output?
4. Has there been a significant reduction in the national unemployment rate between January and February?
Q10. The Governor of a southern state has asked Kaplan Consulting to determine if the state were able to increase the percentage of its population with a Bachelor's Degree to 45%, what might be the expected median household income based on 2000 data? Here is the output from the Regression procedure from Excel.
SUMMARY OUTPUT
|
Regression Statistics
|
|
Multiple R
|
0.718033536
|
|
R Square
|
0.515572158
|
|
Adjusted R Square
|
0.505479912
|
|
Standard Error
|
4548.142979
|
|
Observation
|
50
|
|
|
Coefficients
|
Standard Error
|
t Start
|
p-value
|
|
Intercept
|
15606.01508
|
3717.168291
|
4.198361188
|
0.000115689
|
|
Bachelors
|
976.2529817
|
136.5876943
|
7.147444626
|
4.37107E-09
|
1. What would be the predicted median household income if the percentage of the population in the state were 45% or 45?