Reference no: EM131003293
PART A:
Question 1:
Ten years ago, an advertising agency took a random sample of 20 personal computer owners who used brands such as Dell, Gateway, Hewlett-Packard, etc. At the time, the agency recorded a satisfaction score, with a maximum of 100 possible points. Now the same people were contacted and scored again. The scores for each of these 20 people follow.
Past: 60 68 76 78 73 66 71 89 78 82
66 69 72 89 90 93 85 77 88 70
Now: 80 90 88 78 88 79 74 99 88 77
78 60 72 80 90 97 66 86 88 87
a. Use an ordered stem and leaf display to sort the scores for 'now'. Don't forget to include an appropriate scale.
The descriptive statistics for both surveys follows.
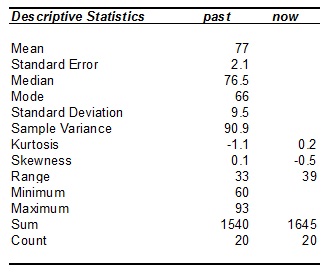
b. Copy the table of descriptive statistics for 'now' into your answer booklet. Complete the table by finding all the missing values.
c. The scores for one survey period were more variable than for the other. For which survey were the scores more variable. Explain.
The boxplot for the survey on customer satisfaction conducted 'now', follows.
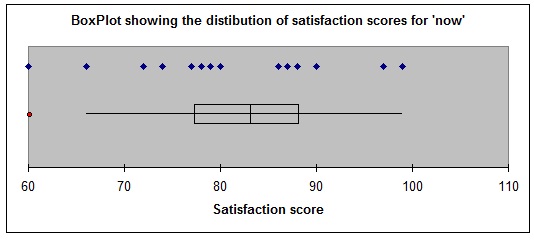
d. Are there any outliers in the data? If so, what value(s) are these. How do we determine whether there are any outliers in a set of data.
e. Is the data for the survey conducted 'now' skewed or symmetric. If skewed, indicate the direction of skewness. Include two different reasons from any of the information or plots provided to justify your decision.
Question 2:
a. Parliament has just voted on a very hot issue, which required a conscience vote. A political scientist interested in the outcome of the vote analysed the result of the voting by the major political parties.
ALP Liberal
For 25 32
Against 22 20
Abstain (did not vote) 5 3
i. If an ALP politician was selected at random, what is the probability that he/she voted for the issue?
ii. If a politician was selected at random what is the probability that he/she voted for the issue?
iii. Are political affiliation and voting on the issue independent events? Explain using probabilities.
b. The company which produces mars bars, is running a promotion on its mars bars. It states that 1 in 5 people will win a free mars bar if they purchase one. If a family of six each buys a mars bar, what is the probability that
i. exactly three will receive a free mars bar.
ii. at least three will receive a mars bar.
c. An executive drives from his home in the suburbs to his work place in the city each day. The driving times are normally distributed with a mean of 35 minutes and a standard deviation of 8 minutes.
i. For what proportion of days will it take him 30 minutes or less to drive to work?
ii. For what proportion of days will it take him between 25 and 40 minutes to drive to work?
iii. Some days there will be accidents or other delays, so the trip will take longer than usual. How long will the longest 10% of trips take?
Question 3:
a. The quality control manager at a light bulb factory needs to estimate the proportion of defectives in a large shipment of light bulbs. The number of defective light bulbs in a random sample of 100 light bulbs was found to be 6.
i. Find a 95% confidence interval estimate of the true proportion of defective light bulbs in this shipment.
ii. What conditions would need to be satisfied so that the sampling distribution can be considered to have an approximate normal distribution? Check that these have been satisfied.
iii. Determine the sample size necessary to estimate the true proportion of defective light bulbs to within 0.02, with a 99% level of confidence.
b. The sign on a lift states "Maximum capacity 25 persons or 2250kg". If the average weight of the population is believed to be 80 kg with a standard deviation of 15, what is the probability that the lift will be overloaded?
c. A manufacturer of sleeping pills claims that the pills will guarantee a patient at least 8 hours of uninterrupted sleep. A doctor measures the amount of sleep that 5 of his patients have before waking (data in table below), after taking the sleeping pill. Is there evidence at , that the time spent asleep is less than 8 hours?
Patient 1 2 3 4 5
Hrs sleep 7.3 8.5 6.4 9.0 6.9
Question 4:
a. The Jamestown Steel Company manufactures and assembles desks and other office equipment at several different plants. The weekly production of a certain desk at its northern plant is normally distributed with a mean of 200 and a standard deviation of 16. Recently, due to market expansion, new production methods have been introduced and new employees hired. The vice president of manufacturing would like to investigate whether there has been an overall change in the weekly production of this type of desk at its northern plant. A random sample of 10 weeks showed a mean of 220 desks. Use a 0.01 level of significance to test whether the weekly production level has changed.
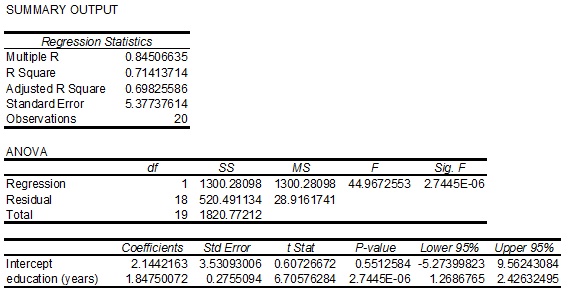
b. We want to investigate a possible association between the annual incomes earned by the residents of a country and the extent of their formal education. A random sample of twenty residents were selected and their annual income ($ 000's) and formal education (years) recorded. A simple linear regression analysis of the relationship between income and education was performed. The computer output generated by Excel follows.
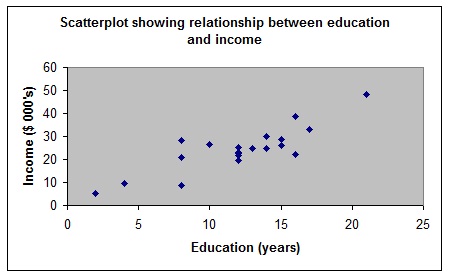
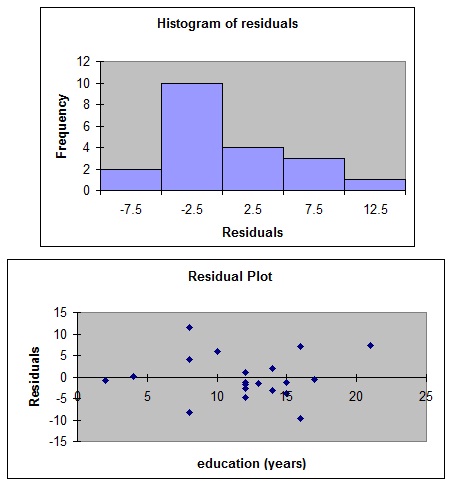
i. Examine the scatterplot and comment on the relationship that exists between the two variables.
ii. What is the equation of the least squares regression line for predicting the annual income from the years of formal education.
iii. Interpret the meaning of both the estimated regression coefficients in terms of the original problem.
iv. What is the predicted annual income of a person from this country who has had 15 years of formal education?
v. One of the assumptions of regression analysis is that the error variable is normally distributed. From the information provided, do you think this assumption has been violated? Explain.
vi. Is the relationship between education and annual income significant? Use a significance level of 0.05.
PART B:
Use the following information to answer questions 1. and 2.
Customers were surveyed regarding their preferences for different brands of coffee.
1. The data collected would be an example of data which is classified as
A. quantitative and ratio.
B. qualitative and ordinal.
C. quantitative and interval.
D. qualitative and nominal.
E. quantitative and ordinal.
2. The data would be best presented graphically as
A. a scatterplot.
B. a histogram.
C. a line graph.
D. a relative frequency ogive.
E. none of the above.
Use the following information to answer questions 3., 4. and 5.
The number of hours worked by a sample of 50 casual employees of a large supermarket chain over the period of one week, were recorded. Excel was then used to construct a frequency distribution shown below, for these data.
Bin Frequency
5 2
10 9
15 16
20 10
25 9
30 4
3. The median number of hours worked is in which class?
A. > 5 up to and including 10.
B. > 10 up to and including 15.
C. > 15 up to and including 20.
D. 10 to 15.
E. 15 to 20.
4. What proportion of employees worked more than 15 hours?
A. 16
B. 0.18
C. 0.2
D. 0.26
E. 0.46
5. The mean and standard deviation number of hours worked can be approximated by
A. 15.2 and 6.6 respectively.
B. 15.2 and 6.5 respectively.
C. 17.7 and 6.6 respectively.
D. 17.7 and 6.5 respectively.
E. 17.5 and 6 respectively.
6. The mean weight of a random sample of 300 first year university students is 65 kg, with a standard deviation of 7 kg. If the distribution of the weight of all first year university students is normally distributed, which of the following statements is true?
A. At least 225 students will weigh between 58 kg and 72 kg.
B. At least 225 students will weigh between 44 kg and 86 kg.
C. At least 225 students will weigh between 51 kg and 79 kg.
D. roughly 204 students will weigh between 58 kg and 72 kg.
E. roughly 285 students will weigh between 58 kg and 72 kg.
7. If and , then equals
A. 0.20
B. 0.10
C. 0.90
D. 0.40
E. 0.89
8. Given that Z is a standard normal random variable, find
A. 0.8849
B. 0.3849
C. 0.1151
D. 0.1539
E. 0.1131
9. If two events A and B are mutually exclusive, then equals
A. 0
B.
C. 1
D.
E.
10. Given that Z is the standard normal variable, find a where
A. 0.54
B. -0.54
C. 0.82
D. -0.82
E. can't be determined because 0.7054 is greater than 0.5
Use the following information to answer questions 11. and 12.
The owner of the local service station notices that on average, 5 cars arrive every ten minutes. If we assume that cars arrive randomly and independently,
11. find the probability that exactly 3 cars arrive in the next 10 minutes.
A. 0.265
B. 0.125
C. 0.140
D. 0.735
E. 0.860
12. find the probability that exactly 9 cars arrive in the next 30 minutes.
A. Three times the answer to the previous question.
B. Exactly the same as the previous question.
C. 0.070
D. 0.037
E. 0.033
13. A student has just performed a one tail, lower tail hypothesis test, which resulted in a test statistic value of . The p-value for this test would be
A. impossible to determine, since we don't know the null and alternative hypotheses.
B. 0.0179
C. 0.5179
D. 0.4821
E. 0.9821
Use the following information to answer question 14.
If the null and alternative hypotheses are
Ho : μ = 50
HA : μ > 50
14. The appropriate test would be a(n)
A. lower tailed test.
B. two tailed test.
C. upper tailed test.
D. upper tailed test containing only half the level of significance.
E. lower tailed test containing only half the level of significance.
15. Which of the following statements about a type I error is true?
A. A type I error is made when the null hypothesis is accepted when it is false.
B. A type I error is made when the null hypothesis is rejected when it is true.
C. A type I error is made when the null hypothesis is accepted when it is true.
D. A type I error is made when the alternate hypothesis is accepted when it is true.
E. None of the above statements is true.
16. A sample of size 10 has a mean of 15.2. The sample was taken from a population with a standard deviation of 2.4. If a 95% confidence interval was calculated for the true population mean it would be calculated by
A. 15.2 ± (1.96)(2.4/√10)
B. 15.2 ± (1.645)(2.4/√10)
C. 15.2 ± (2.228)(2.4/√10)
D. 15.2 ± (2.262)(2.4/√10)
E. 15.2 ± (2.262)(2.4/√9)
17. In regression analysis, as the standard error of estimate becomes smaller, the coefficient of determination is expected to
A. approach zero.
B. decrease.
C. become negative.
D. approach one.
E. become greater than one.
18. In the simple linear regression model, which of the following statements is not true?
A. The explained variation can be less than or equal to the total variation.
B. The unexplained variation must always be less than the explained variation.
C. The unexplained variation can be less than or equal to the total variation.
D. There is no unexplained variation when the coefficient of determination is equal to one.
E. The coefficient of correlation takes values between plus and minus one.
19. Following is a scatterplot showing the relationship between the price of second hand cars and the reading on the odometer.
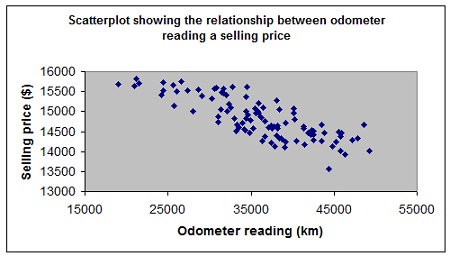
From this plot we can determine that the correlation between these two variables is closest to
A. -0.8
B. 0.8
C. -0.2
D. 0.2
E. 0.7
20. A simple linear regression analysis, of the relationship between the selling price and odometer readings for second hand cars, was performed using MS Excel. A portion of the output follows.
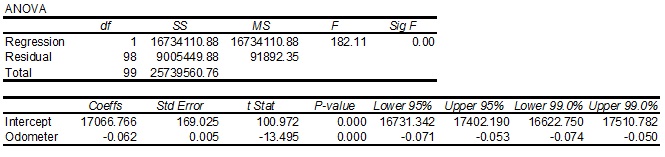
The 99% confidence interval estimate of the slope coefficient is the interval from
A. 16 731.342 to 17 402.190
B. 16 622.750 to 17 510.782
C. -0.074 to -0.050
D. -0.071 to -0.053
E. -0.053 to -0.074