Calculate the monthly specific returns

Assignment Help Finance Basics
Reference no: EM131003296

Question 1:

(a) Check the Q1a tab in the Excel spreadsheet that provides the summary statistics of 84 regressions based on cross-sectional data for each month between January 2001 and December 2007. The following summary statistics are shown in the spreadsheet:
• multipleR
• R-square
• adjusted R-square
• standard errora
• significance of F.
Define each of the above terms and interpret each of the statistics in regards to the data over the time period from January 2001 to December 2007.

(b) (i) Consider the following notations:
Ri = return of stock i for a particular month
Xi1 = exposure of stock i to the constant unit of 1
Xi2 = exposure of stock i to the size
Xi3 = exposure of stock i to the momentum
Xi4 = exposure of stock i to the value
f1 = the intercept term
f2 = the regression coefficient of size
f3 = the regression coefficient of momentum
f4 = the regression coefficient of value.

Complete the formula for the specific returns (or residual term) of stock i for a particular month,Ui, given the information above and the linear regression model. What do the specific returns attempt to measure?

(ii) Calculate the monthly specific returns (i.e. the residuals of the regressions) for CBA, WES and BHP for the 84-month in-sample period. To do this calculation, use the formula derived from part (i), the data given in the notations in part (i), and the data in the ‘Q6b' tab of the Excel spreadsheet.

From your Excel results, paste a copy of the specific returns for CBA, WES and BHP forthe months of January 2001 and December 2007onlyin the Word document of your assignment (and in the format below).

Month

CBA

WES

BHP

Jan. 2001


Dec. 2007


(c) Calculate the historical variance of the monthly specific returns for CBA, WES and BHP for the 84 month in-sample period.
Note: The specific returns are assumed to be uncorrelated so that the off-diagonal elements of the covariance matrix are zero.
From your Excel results, paste a copy of the monthly specific returns covariance matrix for CBA, WES and BHP in the Word document of your assignment (and in the format below).


Monthly specific returns covariance matrix


CBA

WES

BHP

CBA


WES


BHP


See the ‘Q1c-d' tab of the Excel spreadsheet.

(d) From your Excel results, paste a copy of the annualised specific returns volatilities for CBA, WES and BHP in the Word document of your assignment (and in the format below). See the ‘Q1c-d' tab of the Excel spreadsheet.


Annualised specific returns volatility


CBA

WES

BHP

CBA


WES


BHP


Question 2:

Answer the questions below, providing reasons and valid arguments to demonstrate your understanding of regression limitations and how to manage them in practice.

(a) Describe the four (4) conditions that must be satisfied for a regression analysis to be valid.

(b) Describe two (2) ways of dealing with heteroscedasticity.

(c) Calculate the rolling 12-month volatility of price returns for each of the 10 stocks over the in sample period using data in the ‘Q7' tab in the Excel spreadsheet.

Note:The rolling 12-month volatility at any month is the annualised standard deviation using the monthly returns of the preceding 12 months.

Save your Excel workings for part (c) as a tab labelled ‘2c'.

(d) Draw a graph of the results in part (c).Based on the graph, describe the relationship between volatilities of stocks over time.
(e) Explain the Durbin-Watson test and how its results should be interpreted.
(f) Why would a transformation of the dependent variable be used?
Describe what sorts of transformations are commonly used.
(g) Explain four (4) steps in a backward elimination stepwise regression approach.

Question 3

Use Figure 1 to answer the questions below.
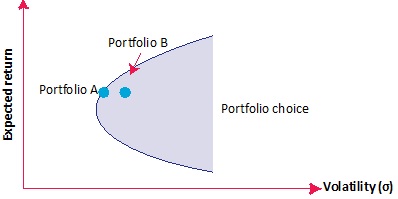
1208_Explain how volatility is measured.jpg

Figure 1

(a) (i) What does Figure 1 depict and what is the financial name or description given tothediagram?

(ii) Which portfolio (A or B) would be preferred and why?

(b) Explain how volatility is measured with respect to Figure 1.

(c) (i) A portfolio manager decides to allocate superannuation funds of their recent clients who are more risk averse than average. What would the portfolio manager need to do to achieve this outcome?

(ii) Briefly state where this portfolio of assets would be represented with respect to Figure 1.

Question 4:

Assume that we have estimated the following AR(1) model:

Xt = 0.0825 + 0.7654Xt - 1 + et

Furthermore, assume that the current level of X is 0.4968.

(a) Forecast the value of X at time 1 (X1) and time 4 (X4).

(b) Which of these two forecasts is likely to be more reliable? Why?

(c) What is serial correlation? How do we test for its presence in this model?

(d) What is the mean reverting level of this model? What does this mean?

Attachment:- FIN201.xlsx

Reference no: EM131003296

Questions Cloud

Why does the firms supply curve slope up in the short run : Why does the firm’s supply curve slope up in the short run (i.e. what assumption is employed to argue that the supply curve slopes up in the short run)?
Determining a model for career development : Your Task: The Human Resource Manager for your branch has noticed that the current branch Standard Operating Procedure (SOP) is outdated. You have been assigned the task of determining a model for both career development and career counseling at ..
Pick a health-related organization and study its website : There are many sites on the Internet that have information on healthcare and health information technology. Pick a health-related organization and study its website. Prepare a 1-2 paper describing the information and resources found on the site. E..
What the benefits of having a flexible budget : What the benefits of having a flexible budget? What are some of the downsides of having a flexible budget? Do you think the budget busters are accurate? Why or why not
Calculate the monthly specific returns : Calculate the monthly specific returns (i.e. the residuals of the regressions) for CBA, WES and BHP for the 84-month in-sample period -  Calculate the historical variance of the monthly specific returns for CBA, WES and BHP for the 84 month in-sampl..
Why is stock-based compensation added to net income : How is the undelivered portion of Microsoft's sales of Windows XP Professional recorded initially?
How many em iterations are needed for convergence : How many EM iterations are needed for convergence? Plot a contour plot of your final GMM pdf. Overlay the contour plot with a scatterplot of the data set.
Spring 2002 exam : Ten years ago, an advertising agency took a random sample of 20 personal computer owners who used brands such as Dell, Gateway, Hewlett-Packard, etc. At the time, the agency recorded a satisfaction score, with a maximum of 100 possible points.
Do you feel that the tools and technologies are appropriate : Then, review the tools and technologies posted by your classmates. Imagine that you were going to be tasked to assist them with their project. Based on their recommendations, do you feel that the tools and technologies are appropriate? Would you r..

Reviews

Write a Review

Finance Basics Questions & Answers

  What is the value of a share of stock

A firm paid a $3.00 dividend last year and dividends are expected to grow at 15% for the next 5 years and 5% thereafter. If the required return is 13%, what is the value of a share of stock?

  Suppose two factors are identified for the us economy the

suppose two factors are identified for the u.s. economy the growth rate of industrial production ip and the inflation

  What are the potential risks

What are the benefits to Boeing of outsourcing so much work on the 787 to foreign suppliers? What are the potential risks? Do the benefits outweigh the risks?

  Weaknesses of ratio analysis

Describe the weaknesses of ratio analysis.

  What are the basic requirements for the project plans

This was quick and easy, but it has its shortcomings, and the Earned Value Management process is said to be better.

  Fly season in the central city school system

Flu cases this past fly season in the Central City school system were about 15 per week. For the entire state, the weekly average is 16 and the standard deviation, 2.35. Are the kids in Central City as sick as the kids throughout the state?

  Truck co is considering the purchase of a new production

truck co. is considering the purchase of a new production machine for 200000. the purchase of this machine will result

  Influencing the price level

The thrifts had their origins in the early 1800s except for the credit unions which began in the early 1900s. All of them were established to provide a place where small savers could place their savings

  The abc corporation has cash outflows of 100 per day seven

the abc corporation has cash outflows of 100 per day seven days a week. the interest rate is 5 and the fixed cost of

  Mission and the vision of current ceo

• Identify their mission and the vision of their current CEO • Assess the macro environment (specific to the industry not to the firm) or PESTEL analysis

  What is the dollar size of the issue

What is the dollar size of the issue? Summarize your analysis in a concise management statement not to exceed 100 words.

  If the before-tax equity reversion after four years equals

with a purchase price of 350000 a warehouse provides for an initial before-tax cash flow of 30000 which grows by 6

Free Assignment Quote

Assured A++ Grade

Get guaranteed satisfaction & time on delivery in every assignment order you paid with us! We ensure premium quality solution document along with free turntin report!

All rights reserved! Copyrights ©2019-2020 ExpertsMind IT Educational Pvt Ltd