Reference no: EM131217369
Object of the Assignment:
1. To use pipe network computer software (EPANET Version 2.0) to create a pipe network computer model from a given configuration of reservoirs, pipes, valves, pumps, etc.
2. To determine the pipe flow velocities and hydraulic grade lines (HGLs) at the nodes throughout the network for three distinct stages of development. (From a village to a major city.)
3. To determine the pump set configuration needed to supply STAGE 3 of the planned development.
4. To answer questions associated with the results of the pipe network analysis and the overall design of the water supply system.
Project Details:
Shenzhen is a rapidly growing city in China located on the border with the New Territories adjacent to Hong Kong Island. The Sham Chun River flows past the growing city and discharges into the nearby Deep Bay. The project is to model the three stages of development of the city, the past, present and future.
STAGE 1 is set in 1978 when Shenzhen was a village with a high quality untreated water supply system feed by pipeline from the local mountains.
STAGE 2 is set in the present 2016 where the village has been rebuilt. The buildings have a maximum height of 20 metres and a new water supply system has been constructed in a loop system. The maximum allowable head in the pipe system is set at 95 m and the minimum head over each property meter, assumed at ground level, is 15m.
STAGE 3 is set in 2030 following the construction of sky-scrapers in the centre of the city where the peak hour demand is equivalent to 4000 l/s. To cater for this development and the continuing growth of the city a new water treatment plant pumping water from the river is planned. Sky-scrapers (200 m) are supplied by basement pumps (activated by float valves) and small roof-top reservoirs.
Attached sketches (Figure 2, 3 and 4) show the development stages and the pipe network details for all STAGEs.
It is your task to sequentially model the pipe network for the three stages and to answer the questions.
Assumptions for the Computer Programs.
1. All demands are peak hour consumptions.
2. Use the Hazen - Williams's formula.
3. Use a constant pipe roughness of 100.
4. Pipe diameters in millimetres, pipe lengths in metres, velocities in metres per second, elevation in metres and pressures in metres.
5. Demands for the three stages are shown on each of the sketches.
6. Characteristics for a single pump curve are shown below (Figure 1).
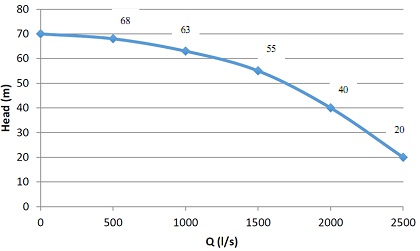
Figure 1: Pump performance curve of a single booster pump
Steps to follow:
To Build a Computer Model for STAGE 1 using EPANET
1. Draw the nodes for STAGE1 as shown in Figure 2 in EPANET. Set the properties of reservoir and nodes and remember to set the demand at node 103 to 100 l/s. Under the tab "Project" and then "Summary", give the project title as STAGE 1 Preliminary.
2. Run the program. Check the HGL over the village of Shenzhen. If your HGL at node 103 is 134.46 (134 or there about) you are right so far. Save this file in a particular format as BM_S1_1 [meaning Bandita Mainali (use initials of your name) _Stage 1_Preliminary]. Check if the velocities in links are under 3 m/s or not.
3. Since this HGL is above the maximum allowable head of 95 m, a pressure reducing valve (PRV) must be installed in pipe 2. For this delete pipe 2 and add PRV from node 102 to
103. Head loss across the valve should be close to 40 m (135 m - 95 m = 40 m), so put a value close to 45 in "Settings" for PRV (Hints is given here as this is the first time you are using PRV for your model).
4. Run the program. Check that the HGL of the node 103 is less than 95 m. If it is, continue, if it is not check your work. Under the tab "Project" and then "Summary", give the project title as STAGE 1 Final. Save the data file under another name - BM_S1_2 (meaning Bandita Mainali_Stage 1_Final.
To Build a Computer Model for STAGE 2
5. Now use Stage 1 final file to model for STAGE 2. Update the title from STAGE 1 Final to STAGE 2 Preliminary and build a model for stage 2 according to the Figure 3.
6. Run the model and check for the HGL and velocities in nodes and links respectively. Call data files as BM_S2_1 (meaning Bandita Mainali _Stage 2_Preliminary).
7. See if you require to increase or decrease pipe diameter (on the basis of velocities in the links) or add PRV (if the pressure at nodes is above 95 m) as per the result from your preliminary model. Use strategies such that the HGL at nodes and velocities of links are under working range. When you achieve your target, save the file as BM_S2_2 (meaning Bandita Mainali_Stage 2_Final) and update the project title to STAGE 2 Final.
To Build a Computer Model for STAGE 3
8. Run EPANET using BM_S2_2 and update the title from STAGE 2 Final to STAGE 3 Preiminary and build a network for STAGE 3 as shown in figure 4. Run the model. You may witness a EPANET warning message. Check the report, you may see many negative pressures across many of the nodes which means you require to increase pressure to flow from reservoir C. What will be your strategy? Save this file as file BM_S3_1 (meaning
Bandita Mainali_Stage 3_Preliminary).
Note : Since the water treatment plant storage is at a low level, it is necessary for you to place a booster pump in pipe 13 (or 12 and 14 also, try different options). The characteristics for a single booster pump have been given earlier (Figure 1). You have to work out how many pumps you need and whether they are in parallel or series. (With your knowledge of pumps you should be able to look at the
single pump curve, the HGLs and estimate what is worth trying. Remember, the duty point of the pump is at 1500 l/s and the working range is plus or minus 500 l/s.
9. Check if the residual HGL at nodes is in the working range. Proceed and work out a strategy for the STAGE 3 design that places the HGL in the working range as well as velocities in the link should be less than 3 m/s. Save changes and call the file BM_S3_2.
10. Provide a functional design for a pump system to supply four identical sky-scrapers, 200 m tall, with a peak hour consumption of 4000 l/s. For this exercise assume for the peak hour the basement pumps run continuously as there is insufficient storage in the roof top tanks.
Presentation of Results:
1. You will need to submit a REPORT and this report must be easy to follow and understand otherwise you will lose marks.
2. Clearly label all presented files.
3 Present both Preliminary and Final files of STAGE1, STAGE 2, STAGE and present summary data for all files and for any additional work presented.
Requirements and Questions and Assessment:
1. Briefly describe the functions of:
(a) Check valves.
(b) Pressure reducing valves.
(c) Booster pumps.
(d) Wet/Dry pumping installations at the low level water storage and water treatment plant.
2. For STAGEs 1, 2 and 3 present your strategies and output files to bring your worked out HGLs and velocities into the working ranges. Remember your networks for all pipes and nodes (number and properties) in all 3 stage should match with given figures.
3. For each stage draw the operational HGL.
4. Review your final output file and comment on the velocities and pressures in the pipe network. Suggest additions and modifications you would have made to pipe network (diameters/locations/duplications etc) if you were the design engineer designing for the 24 hours operation of STAGE 2 and STAGE 3. Give your reasons.
Note: Provide good illustrations of your design (correct design) and strategies with necessary screenshots and present well to enable yourself to receive good marks.
Attachment:- EPANET.pdf