Reference no: EM132219466
Lab - Attention
I. Project
The goal of this lab is to implement an experiment to examine spatial attention. The idea of attention as a process by which mental resources can be concentrated or focused continues to pervade thinking in the scientific study of attention. Psychologists and neuroscientists have divided the concept into three different forms: space-based, object-based, and feature-based attention. In this lab, we will focus on spatial attention. Helmholtz (1894) was one of the first experimentalists to demonstrate that one could covertly (i.e. by holding the eyes fixed) shift one's attention to one part of space prior to presentation of a long list of characters. He found that one could more effectively recollect the characters within the region of space to which the "attentional search light" was shifted.
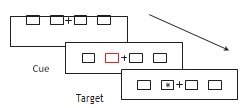
In the modern study of attention, the Posner paradigm (Posner, 1984) has been particularly influential. In this task, subjects are asked to fixate in the center of screen and not to break fixation for the duration of the trial. Then, a location on the screen is cued in some way (usually by high-lighting or flashing something). After the cue, a target comes on in either the cued location or in another location (in the figure, the target is an asterisk). Subjects are instructed to press a key as soon as they see the target. See below for a schematic illustration of the paradigm:
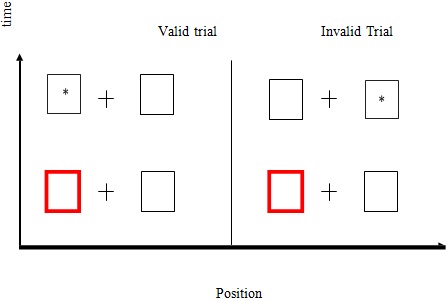
Posner found that if the cue is valid, reaction time was substantially lower than if it was invalid. He interpreted this in terms of a "attentional spotlight" that is focused on a certain region in space and permanently shifting at a finite and measurable speed.
In this project, we will implement a Posner task and measure the speed of the "attentional spotlight" in the horizontal direction. Make sure to:
– Plot something (say a "+") in the middle of the figure to fixate on during the experiment.
– You will plot a cue in one of four positions, two to the left of the fixation point and two to the right. The cue should attract attention, but be briefly visible (say 50 ms).
– After a pause (say 300 ms), you will briefly plot a target (say a red square for 150 ms) in the one of the four target locations. If the target location is the same as the cue location, this is a valid trial. If not, it is an invalid trial.
– Have the user hit a single key when and if a target is detected. Include about 15% of non-target trials (i.e. trials without the target).
– Trial end: If the key is pressed, the trial should end at that point. If no key is pressed, trial end should occur at a fixed time after the disappearance of the cue (e.g. 1 second).
– Record the reaction times for trials with target present, as well as the cue and target position.
– Make sure to have a roughly equal number of valid and invalid trials. Also randomize the cue and target locations (for the invalid trials).
– Collect at least 100 correct trials for both the valid and invalid conditions.
II. Lab Report Requirements
1. Plot the cue, the target, and the fixation point on the same graph for an invalid trial.
2. What is the mean reaction time for the valid versus the invalid trials? Is this difference significantly different (use ttest2 in Matlab)? Report the p-value. Is this the result you expected? How do you expect varying the ratio of valid to invalid trials would affect the results?
3. Plot the mean reaction time versus the distance between the target and cue (ranging from 0 to 3). Estimate the slope of this line. What is the speed of the "attentional spotlight" in targets/second? What is the (approximate) speed in cm/s?
4. This lab is due at 5:00 pm February 1, 2019. Submit your lab through Canvas.
III. Hints
Plotting targets: An easy choice for plotting targets and cues is the rectangle function:
figure %Create a new figure
xlim([1 5]) %Set the range of values on the x-axis
ylim([1 3]) %Set the range of values on the y-axis t=rectangle('Position', [2 1 1 1]); %A 1x1 rectangle whose lower left is at (2,1)
If you declare the rectangle with a handle, you can change the properties of the rectangle. Type get(t) for a list of these properties. For example, you can make your rectangle red by typing:
set(t,'FaceColor','r') %change rectangle color
To delete the rectangle, either clear the figure with clf or make it invisible:
set(t,'Visible','off') %make rectangle not visible
Significance testing: Regarding data analysis, the most important function we can introduce at this point is the t-test. Matlab uses ttest2 to test the hypothesis that there is a difference in the mean of two samples.
A = rand(100,1); %Create a matrix A with 100 random elements in one column B = rand(100,1); % Create a matrix B with 100 random elements in one column [significant,p] = ttest2(A,B)
For me, Matlab returned the values below. Of course, since these are random numbers, Matlab should return something different for you.
significant = 0
p = 0.6689
These values means that the null hypothesis was kept, as we failed to reject it. We failed to reject because the observed difference in means (given the null hypothesis is true) had a probability of about 0.67, which is far too high to reject the null hypothesis. This was to be expected. Now try this:
B = B .* 2;
[significant,p] = ttest2(A,B) significant =
1 p = 3.3467e-013
Now, the null hypothesis was rejected. As a matter of fact, the p-value is miniscule.
Seeding the random number generator: If you use the rand() function just as is, the SAME sequence of random numbers will be generated each session. You can avoid this by seeding it first, for example like this: rand(‘state',number). It is popular to make the number after a state argument dependent on the cpu-clock:
rand(‘state',sum(clock))
Functions: You may (or may not) find the lab easier to complete by writing a function which
handles the plotting of the targets. You would pass the function your trial conditions, and the function would return the reaction time.
Then in a separate m-file you could handle looping through all 1280 trials. If you are not comfortable with functions, you can also put everything in one m-file. However, you might try experimenting with the functions. For example, you could create an m-file called calcSum.m which contains the following (do not name it "sum" as that is already a Matlab function):
function output=calcSum(a,b) output=a+b;
Now in the command line, try typing:
calcSum(2,3)
Picking a target location for invalid trials. When the trial is invalid, you need to pick a new location which is not the same as the original location. If a stores the cue location b stores the target x location, you draw random numbers until b is not equal to a. you get a pair which are not the same as the original numbers. You can do that with a while loop, which will say in the loop as long as the condition is true (the locations are the same). Not the conditions after "while" have double equals signs, not a single one.
a=ceil(rand*4); %picks 1,1,2,3,4 with equal probability b=a;
while (a==b) %do this while the two locations are the same. b= ceil(rand*4);
end
Hitting the key too soon - you may have noticed that if you hit the key before the target appears, your keystroke is outputted as text to the command window. If your command window is minimized, it will pull up the window and obstruct your figure. The easiest way to deal with this is to shrink the command window so it appears side-by-side with the figure. This way you can continue playing. It may affect your time for that trial, but hopefully this won't significantly impact the results. Also, you can try adding a pause in between each trial.
Attachment:- Lab Attention.rar