Identify the parameter of interest to the researchers

Assignment Help Basic Statistics
Reference no: EM131402524

Personality and aggressive behavior. How does personality impact aggressive behavior? A team of university psychologists conducted a review of studies that examined the relationship between personality and aggressive behavior (Psychological Bulletin, Vol. 132, 2006). One variable of interest to the researchers was the difference between the aggressive behavior level of individuals in the study who scored high on a personality test and those who scored low on the test. This variable, standardized to be between -7 and 7, was called ‘‘effect size.''

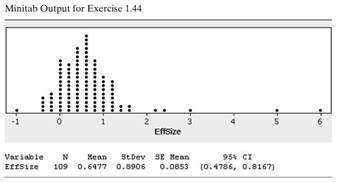
(A large positive effect size indicates that those who score high on the personality test are more aggressive than those who score low.) The researchers collected the effect sizes for a sample of n = 109 studies published in psychological journals. This data are saved in the PERAGGR file. A dot plot and summary statistics for effect size are shown in the accompanying MINITAB printouts (bottom of p. 40). Of interest to the researchers is the true mean effect size μ for all psychological studies of personality and aggressive behavior.

2232_Figure 3.jpg

(a) Identify the parameter of interest to the researchers.

(b) Examine the dot plot. Does effect size have a normal distribution? Explain why your answer is irrelevant to the subsequent analysis.

(c) Locate and interpret a 95% confidence interval for μ on the accompanying printout.

(d) If the true mean effect size exceeds 0, then the researchers will conclude that in the population, those who score high on a personality test are more aggressive than those who score low. Can the researchers draw this conclusion? Explain.

Reference no: EM131402524

Questions Cloud

Examine the impact of health policy on nursing management : Examine the impact of health policy on nursing management. Examine the report as an exemplar when discussing governance, and related quality topics in the unit. For Assignment 2, answer the following questions:
Is the asset a long-maturity asset or a shortmaturity asset : Which of the properties of money (medium of exchange, store of value, unit of account) does the asset have? Would we consider it money and why or why not?
Estimate the population mean number of pecks : Estimate the population mean number of pecks made by chickens pecking at blue string using a 99% confidence interval. Interpret the result.
Analyze implications of these policies and disparities : Compare the economic policies for health promotion, wellness, and prevention programs in the United States and the country you selected. Include differences in approaches to wellness and prevention. Analyze implications of these policies and disparit..
Identify the parameter of interest to the researchers : Identify the parameter of interest to the researchers.- Examine the dot plot. Does effect size have a normal distribution? Explain why your answer is irrelevant to the subsequent analysis.
Do you observe a phillips curve relation in the data : Plot the difference between the unemployment rate and the natural rate of unemployment (short term), and the inflation rate. Do you observe a Phillips curve relation in the data? What if you confine attention to particular sub-periods? Discuss.
What is a naive forecast of inflation : How do we know that the Phillips curve does not help in forecasting inflation?
Find the fraction of a set of measurements : Use Tchebysheff's theorem to find the fraction of a set of measurements that will lie within: 2 standard deviations of the mean (K = 2).
Conduct a test to compare the variation in hydrogen readings : Conduct a test to compare the variation in hydrogen readings for the two sampling schemes.- Test using α = .05.

Reviews

Write a Review

Basic Statistics Questions & Answers

  Research in the gaming industry showed that 10 percent of

research in the gaming industry showed that 10 percent of all slot machines in the united states stop working each

  60 of my students are females and 40 males the average

60 of my students are females and 40 males. the average height for females is 5.8 and average for males is 6.find the

  Presented in graph or table format

Using the Internet, the text, or another reliable source such as a newspaper or periodical site, (not a scholastic or school site like Khan Academy and not Wikipedia), research some important data that has been presented in graph or table format. ..

  What probabilities correspond to the decision rules

let X have one of the following distributions: if the prior probabilities are P(H0)= P(HA) which outcomes favor H0? What prior probabilities correspond to the decision rules with a= 0.2 and a =0.5

  Find p65-65th percentile

Suppose adults have basically distributed IQ scores with a mean of 100 and an SD of 15. Find P65, the 65th percentile. Use the Z table.

  What lifetime should the manufacturer advertise for these

a certain brand of flood lamps has a lifetime that has a normal distribution with a mean of 3750 hours and a standard

  Calculate the expected standard error

Jane Smith is a student in the MBA 751 Econometrics course and she received an 83.6% on her final exam grade. The mean of exam scores is expected to be a 75% with a standard deviation of 8.5%. Compute a Z-score for Jane.

  How many batteries would weigh more than forty eight months

A mean of 45 months and a standard deviation of 8 months. if a random sample of 600 batteries is selected, how many batteries would weigh last more than 48 months?

  Focusing on leadership and change

In this assignment, we will focus on you, your relationship to leadership and change in your work context and the management ideas that have influenced those topics. Rather than testing how carefully you have read the module materials, this assign..

  Hypothesis testing-american male height

According to the U.S National Center for Health Statistics, the mean height for adult American males is mu = 65.5 inches. Assume the heights are normally distributed with standard deviation of sigma = 3.2.

  Assume we want to be 95 confident that the sample

many states are carefully considering steps that would help them collect sales tax on items purchased through the

  Confidence interval for mean time needed for all graduates

Suppose the college in question 12 has only graduated 10,000 students. Construct a 96 percent confidence interval for the mean time required for all graduates to earn a bachelor's degree.

Free Assignment Quote

Assured A++ Grade

Get guaranteed satisfaction & time on delivery in every assignment order you paid with us! We ensure premium quality solution document along with free turntin report!

All rights reserved! Copyrights ©2019-2020 ExpertsMind IT Educational Pvt Ltd