Future economic glowth

Assignment Help Microeconomics
Reference no: EM131034

Although the country produced several types of commodities (goods and services) in the year 2003. but this country's Central Statistics Otice has grouped such commodities into fbur broad categodes (A to D) for the purpose olestimating private consumption and government expenditures for the year 2003.

846_STATUS OF the ECONOMY.png

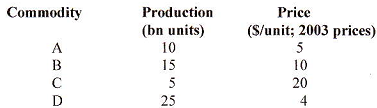
Further, during 2003, $20bn worth ofshares were purchased by the citizen ofthe country. Total corporate prcfits durjng the year were $90bn. Additionally, $200bn was paid as rent, and tbe capital eamed an interest of$8obn in that year.The government also spcnt $5bo on social-securiry benefits, and provided $20bn ofsubsidies to the poor during this year. The indirect taxes contributed $30bn to the government rcvenues and $40bn was paid by the households to the govemment, as direct taxes, during this year.

The wages and salaries for this yeaf amounted to $200bn, and the country imported $40bn worth olgood and services (All prices are in 2003 dollars.) lor the year 2008, the government's dircct ta,xation revenue was $40bn. The govemment spent $20bn on social-security benefits. The net exports for dris year amounted to $0 (all prices are in 2008 dolltrs). Other particulats lor 2008 (at 2008 prices) include:

Govemment productive expenditure  $200bn
Privateconsumptionexpenditure       $400bn
lnterest on capital                        $180bn
Tndirect taxes                             $50bn
Gross investment                         $l00bn
Co.porafe prohts                          $50bn
Wases/salaries                            $260bn

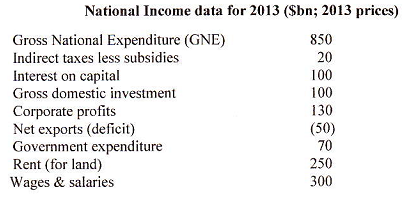
. National lncome data for the year 2013 is shown below.

1217_STATUS OF the ECONOMY1.png

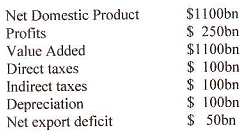
. While it is dilficult to precisely predict future economic glowth' the country's leading economists believe that ifno measures are taken to rcvitalize the economy now (that is' in 2013), the economy will begin to contract and that the futler effect ofsuch contraction will become evident in the year 2018. Various estimates for the year 2018 (al 2018 prices) are:

74_STATUS OF the ECONOMY2.png


. The CDP deflators for the years 2003, 2008, and 2012 ate 86, 90, and 100, respectively lf no investment is made in 2013, the estimated deflator for the year 2018 is expected to be 150.

. lf however an investment is made (in Proposal A or Proposal B) in 2013, the real GDP for 2018 (expressed in 2013 dollars) would be $800bn in the case ofProposal A and $820bn in the case ofProposal B. Due to slightly different economic dynamics associated with these two proposals, the cotesponding GDP deflators, for the year 201 8, would be | 60 and 170, respectively.

Reference no: EM131034

Previous Q& A

  Data modeling and normalization

Data Modeling and Normalization

  Explain supply and demand diagrams

Explain Supply and demand diagrams

  Solve the logarithmic equations

Solve the logarithmic equations

  General business issues

Advice for Dealing with Business Problems

  Produce a project plan

Produce a project plan and an interim description of the project development

  Professional business report on global marketing

Professional business report on Global Marketing

  Professional business report

Format of a professional business report

  Frequency distribution

Accepting Manipulation or Manipulating

  Accepting manipulation or manipulating

Accepting Manipulation or Manipulating

  Write a management report

Please write a Management Report considering your own organisation or department.

Reviews

Write a Review


Similar Q& A

  Case study analysis about optimum resource allocation

Case study analysis about optimum resource allocation: -  Why might you suspect (even without evidence) that the economy might not be able to produce all the schools and clinics the Ministers want? What constraints are there on an economy's productio..

  Effect of the ua increasing sovereign wealth funds on gdp

What is the effect of the United Arab Emirates' increasing sovereign wealth funds on GDP?

  Impact of external costs on resource allocation

Explain the impact of external costs and external benefits on resource allocation;  Why are public goods not produced in sufficient quantities by private markets?  Which of the following are examples of public goods (or services)? Delete the incorrec..

  Problem - total cost, average cost, marginal cost

Problem - Total Cost, Average Cost, Marginal Cost: -  Complete the following table of costs for a firm.  (Note: enter the figures in the  MC   column  between  outputs of  0 and 1, 1 and 2, 2 and 3, etc.)

  Marginal and average cost curves

n a competitive market place (pure competition) is it possible to continually sell your product at a price above the average cost of production.

  Evolution of the price of gold and silver

This document shows the uses supply and demand model to explain the evolution of the price of gold and silver.

  Current economic theory

Current economic theory and their application or lack of application to contemporary economic problems

  Firms operating under cournot competition or cournot market

The details about three identical firms operating in Cournot competition are given. The demand curve with marginal revenue, profit maximization, optimum quantity, total demand and market price related questions are answered.

  Calculate the net present value and benefit-cost ratio

Calculate the net present value and benefit-cost ratio for four different discount rates

  Output maximisation and cost minimisation

Output maximisation and cost minimisation

  Elasticity of price

Does it make sense to hold sleep, work, and leisure fixed while changing study? Why or why not? Explain why this model violates the assumption of no perfect collinearity.

Free Assignment Quote

Assured A++ Grade

Get guaranteed satisfaction & time on delivery in every assignment order you paid with us! We ensure premium quality solution document along with free turntin report!

All rights reserved! Copyrights ©2019-2020 ExpertsMind IT Educational Pvt Ltd