Reference no: EM132822877
Worksheet
QUESTION 1
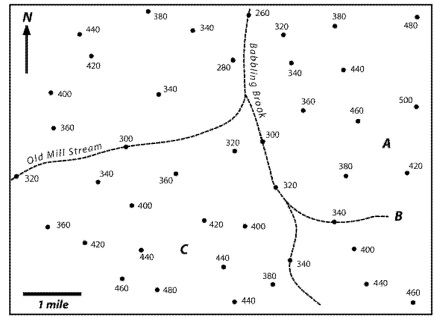
This figure shows many spot elevations in an area around the fictional Babbling Brook and Old Mill Stream. Construct a reasonable topographic map of this area using a contour interval of 20feet (note: use only even 20foot intervals for the contour lines, such as 3817, 400', etc.).
You may have only one or two dots for each elevation so you should make a reasonable guess as to what the spacing of the contours should be. Remember, contour lines will always create a 'V painting upstream as they cross a river: Also, contour lines will NEVER intersect each other. They may bunch together closely in parts of the mop with there is steep elevation, but the elevation lines won't cross.
If you get stuck, try looking at some of the maps from the lecture, or at topographic maps online.
QUESTION 2
What is the elevation of paint A in feet?
QUESTION 3
What is the elevation of point B in feet?
QUESTION 4
What is the elevation of point C in feet?
QUESTION 5
What is the maximum relief on this map (in feet). Show your work in the following question.
QUESTION 6
Show your workfor determining the maximum relief of the mop (question 5).
Question 7.
For this exercise you will need to download the Google Earth .kmz file as well as the PDF copy of the Hartford North Quadrangle map located in the .Important Information" folder. Some questions will require you to use the map located here.
Take a look at the topographic map provided to you. This is the 'Hartford North Quadrangle' moo made by the United States Geological Survey in 1964, which shows portions of Hartford, CT as well as the towns that neighbor Hartford, such as West Hartford, East Hartford, Bloomfield, Windsor, and South Windsor. Topographic maps allow the viewer to interpret the 3-D topography (highs and lows, hills and valleys, etc.) of an area using a fiat, 2-D map. This is done with the use of canto, lines, which are lines that represent areas of equal elevation (height above sea level). On your map, start at the bottom (the southern side - topo maps always have north at the top) and follow the Connecticut River up through Hartford. Just past East Hartford. look for the number '20' that is written in multiple places alone the banks of the river. This number is associated with the contour lines running alone the river and indicates that any point along this line is 20 feet above sea level. Does this elevation value make sense to you? Consider whether or not Hartford is much higher in elevation than the ocean (Long Island Sound) that is located -40 miles to the south.
If you look at the bottom of the map, you will see the declaration: SCALE 1:24000. This means that any distance you measure on the map is equivalent to 24,000 times that distance in real life. So, say you measure that width of the Connecticut River and find that it is Y. of an inch wide. This means that the true width of the Connecticut River in this location is 24,000 x 0.5 in, or 12,000 inches wide. To convert this value to miles, we'd want to divide first by 12 (12 inches = 1 foot) and then by 5280 (5280 feet = 1 mile), which gives us a value of 0.19 miles.
Not for below the SCALE 1:24000 writing on the map are the words. CONTOUR INTERVAL 10 FEET. This is telling you that if you were to walk from one contour line to the next, you'd either be going up or down a total of 10 feet in elevation. Figuring out whether you'd go up or down requires a bit of practice, but one way to tell is by looking for nearby labeled contour lines and determining which way the lines get higher in elevation and which way they get lower. For instance, if you again go to the University of Hartford, you will see that most of the campus is situated around the North Drench Park River, and that the contour line nearest to this river as it winds through campus is labeled '50', meaning 50 feet above sea level. If you move southwest from campus, look for the next bold contour line, which is labeled '100'. This means that it you walk southwest from campus, you are ultimately gaining 50 feet in elevation by the time you reach the toot line. Use this same strategy to answer the following questions:
Review either copy of the map to see if you can find the highest elevation in the City of Hartford. What is this elevation (in feet)?
QUESTION 8.
Look at the Google Earth copy of the map, find the University of Hartford and St. Josephs College on the map. Using the measure tool, about how far apart are these two campuses? Answer in Miles.
QUESTION 9.
Find Trinity College on the map (it is just above and to the left of the SCALE 1:24000 writing at the bottom of the map). If you were to walk directly east from Trinity to Colt Park, would your walk be net uphill or net downhill?
a. Net Uphill
b. Net Downhill
QUESTION 10
What is the approximate elevation (in feet) of Colt Park? (Recall that the contour interval is I0 ft.)
QUESTION 11
One degree of longitude equals about 111 km (70 miles) at the equator, but it does not equal this same distance when you are much closer to the north and/or south pole. Would it he equal to more or less distance, and why?
QUESTION 12
What are the approximate coordinates of the center of the map? Using degrees and minutes is fine. no need to specify seconds - BUT recall that the scale of minutes and seconds is 0-60, not 0-100! Also. ignore the coordinates that look like 4629- or -697000m E'-this is a different coordinate system that we are not using.)
QUESTION 13
Locate Horse Barn Hill on the University of Connecticut Campus (you may have to zoom Ina bit to see it labeled). What is the highest elevation (in Feet) of Horse Barn Hill?
QUESTION 14
Look at the elevation contours surrounding Horse Barn Hill. What is the contour interval in feet?
QUESTION 15
Find Mirror Lake in Storrs. (Hint it is a bit south of Horse Barn Hill). Looking at the Bedrock Geology layer what Formation is Mirror Lake located in?
QUESTION 16
What is the name of the geologic period that represents the age of formation of the bedrock under Mirror Lake?
QUESTION 17
What time range (in millions of years) does this period represent?
QUESTION 18
Now travel west to Hartford.
What formation underlies most of the city?
QUESTION 19
Is the bedrock under Hartford metamorphic, sedimentary, or igneous? If you're having a hard time identifying this rock, feel free to ask your TA for more information.
QUESTION 20
Regarding the bedrock that underlies most of Hartford. during which geologic period did this rock form?
QUESTION 21
If you live in Connecticut find a particular location that is significant to you. It can be where you grew up, or where you live now, or some place you have spent a lot of time. If you have not been to Connecticut choose a place that interests you or simply find a location that caught your attention. Once you zoom in on your chosen location, answer the following,
a. Where is your location? What town is it in? What part of that town? You can provide the generaf vicinity of your location-you it NOT need to give us an address!
b. What is the name of the bedrock underneath your location? If you come across the name of a rock typeyou are unfarmfiar with, feet free to ask your TA for more information.
c. What type of rock is it (metamorphic sedimentary, or igneous):
d. Review the steps involved In the rock cycle. Mentioning one or more of these steps, write a sentence describing how this rock may have formed.
QUESTION 22
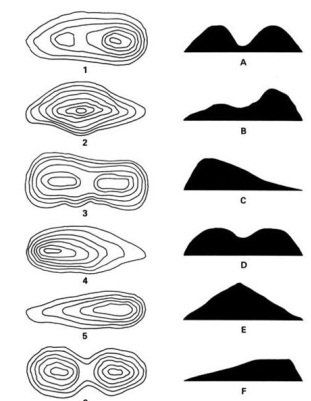
Match the Contours to the Profile.
QUESTION 23
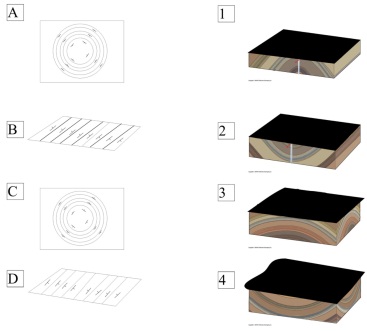
Match the Map View to the Cross Section.
QUESTION 24
QUESTION 25
You can find a PFD of the image in the "Important Information" folder. Print or work digitally and submit a PDF copy of your final product.
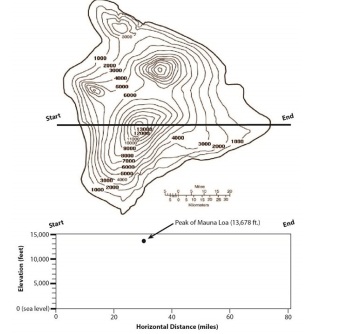
Now that you have a better understanding of topographic maps and contour lines, try your luck at constructing what is known as a topographic profile for The Big Island of Hawaii. A topographic profile is a visualization of how the elevation changes as you move in a particular direction across a map. You may be familiar with this concept if you've ever mapped a walking/running or biking route in Google Maps, as Google Maps provides you with an elevation (topographic) profile so you know how arduous for not) your trip will be.
Steps to follow:
Your starting and ending points are marked on the contour map.
Begin at 'Start' and work your way through the profile by marking a dot on the map every time you cross a new contour line. For instance, your 'Starr point is in the ocean, so this gets a dot at Your next point may then be the start of the island, which is about 7 miles east and still close to 0 in elevation. After another mile or two, you cross the 1000 ft. contour line, so this dot will be nearly 10 miles east of the start of the profile with an elevation of 1000 feet.
Continue this process until you reach the end of the profile. If you are careful and concise, you should end up with almost 30 dots on your profile. Note that the peak of Mauna Loa is also marked for you.
Connect the dots - you've made a topographic profile of the Big Island!
QUESTION 26
Which side is steeper the east or the west side ? How is this reflected in the spacing of the contour lines en the steeper side
QUESTION 27
You can find a PFD of the image in the "Important Information" folder. Print or work digitally and submit a PDF copy of your final product.
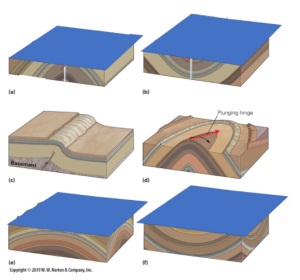
Draw a cross section of the structure in the box provided. To the best of your ability, reproduce the proper dip angles of the rock layers.
Label the different layers A.B.C.D on both the map view and cross section.
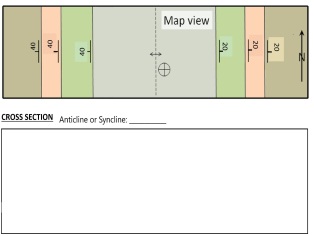
NOTE: The axis of the fold displayed in the map is the dashed line along which at which on one side, the beds in one fold limb dip in one direction, and in the other, the other fold limb dips in another direction. Directly on top of the fold axis, the beds have a dip of zero. Be sure to take into account the different dip directions AND angles on either side of the fold axis.
QUESTION 28
Is the cross section an anticline or a syncline. Explain your reasoning
QUESTION 29
You can find a PFD of the image in the "Important Information" folder. Print or work digitally and submit a PDF copy of your final product.
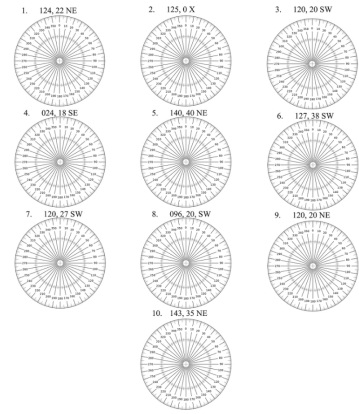
Use the compass images to orient your strike and dip symbols and draw there as they would normally appear on a geologic map
(Having a drawing or image of whatyou drew in this part will wilt make drawing the symbols on the map in the next question easier and more accurate). For legibiliry please use a color other than black. draw these lines.
QUESTION 30
Now that you've drawn all your strike-and-dip measurements in the previous question, follow these steps:
1. Right next to each circled number on the map, draw symbols for the corresponding strike-and-dip measurements from the previous question. Remember that you need to include a number representing the dip angle nextto each strike-and-dip symbol.
2. On the map, draw in the axis of the fold as a dashed lot.
3. Answer the question - does the pattern of strike and dip rneasurements suggest an anticline ar syncline, Include a sentance or two explaining your reasoning.
4. In the empty rectangle at the bottom of the sketchpad, create a cross section of the map.
The map provided is oriented so that North 10 and 360 degrees), at the top of the page, East (90 degrees) is to the right, South el 80 degrees) is to the bottom, and West 270 degrees) is to the left.
Say that you had this map in paper farm and you want to draw a strike-and-dip measurement of 030, 45 SE at the location where you madethe measurement with a compass. Since the top of the map is North and thus represents the 0 degrees strike direction, then you would use a ruler and protrador to draw a short !Me on the measurement's location that is rotated 30 degrees clockwise relatve to north direction on the page.
Since dip is always perpendicular. strike, you only have two optons far how to orient the dip tIck mark - in this case eltherto the NVV or to the SE. Since the dip dredlon is specified as SE, then we just make a small mark point ng in this direction and then write the magnitude of the dip next to 10 45 degrees).
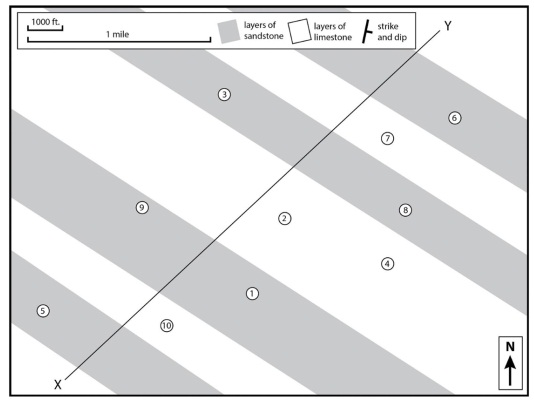
Does the pattern of strike and dip measurements suggest an anticline or syndine?
Imagine that you take a slice through the ground along the line marked X-Y on the map. Draw a cross-section of what the un¬derground geometry of the rock layers would look like.
Attachment:- Lab worksheet.rar