Reference no: EM131405846
Refer to the data in Exercise 1, showing the frequency of coronary heart disease for men with no anger and men with the most anger. Show how the numbers in the following statement were calculated: The odds of remaining free of heart disease versus getting heart disease are about 24 to 1 for men with no anger, whereas those odds are only about 8.5 to 1 for men with the most anger.
Exercise 1
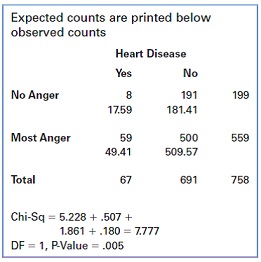
Exercise 2 concerned the relationship between anger and the risk of coronary heart disease. Some computer output for a chi-square test is shown below. What do the results indicate about the relationship? Explain.
Exercise
Do grumpy old men have a greater risk of having coronary heart disease than men who aren't so grumpy? Harvard Medical School researchers examined this question in a prospective observational study reported in the November 1994 issue of Circulation (Kawachi et al., 1994). For 7 years, the researchers studied men between the ages of 46 and 90. All study participants completed a survey of anger symptoms at the beginning of the study period. Among 199 men who had no anger symptoms, there were 8 cases of coronary heart disease. Among 559 men who had the most anger symptoms, there were 59 cases of coronary heart disease.
a. Construct a contingency table for the relationship between degree of anger and the incidence of heart disease.
b. Among those with no anger symptoms, what percentage had coronary heart disease?
c. Among those with the most anger symptoms, what percentage had coronary heart disease?
d. Draw a bar graph of these data. Based on this graph, does there appear to be an association between anger and the risk of coronary heart disease? Explain.
|
Degree of anger and the incidence of heart disease
: Construct a contingency table for the relationship between degree of anger and the incidence of heart disease.- Among those with no anger symptoms, what percentage had coronary heart disease?
|
|
Discuss about the professional portfolio-resume
: you will submit the first document to be included in your Professional Portfolio: Your resume (if you are seeking employment immediately upon graduation) or your curriculum vitae (if you are applying to graduate school). At the end of the documen..
|
|
What are business ramifications and government ramification
: What are the Business ramifications? Government ramifications? Society ramifications? Ethical ramifications? Environmental ramifications? Political ramifications? My position on the issue.
|
|
Prepare one-year strategic plan of action for organization
: Develop a 1-year strategic plan of action for your organization using lessons learned and your learning team activity during Week 1. Include plans for any additional staffing and the proposed budget for your plan.
|
|
Draw a bar graph of given data
: Draw a bar graph of these data. Based on this graph, does there appear to be an association between anger and the risk of coronary heart disease? Explain.
|
|
What percentage had coronary heart disease
: construct a contingency table for the relationship between degree of anger and the incidence of heart disease.- Among those with no anger symptoms, what percentage had coronary heart disease?
|
|
Develop a moral dilemma
: Develop a moral dilemma and discuss how individuals in different levels of moral development may react or interpret the specific situation.
|
|
Discuss about the aspect of culture like healthcare-gender
: Select a source to use for Part I of the paper. You will be using your textbook and the article by Miner for this part of the paper, but for this worksheet, include the source you found through your own research. Review the tutorial onEvaluating s..
|
|
Discuss practical versus statistical significance
: In other words, for every 10,000 "person-years" of women taking the hormones instead of a placebo, there would be eight additional cases of invasive breast cancer. Discuss practical versus statistical significance in this situation.
|