Reference no: EM131405850
Refer to Exercises 2 and 1. Find the odds ratio for remaining free of heart disease for men with no anger compared with men with the most anger. Give the result in a sentence that someone with no training in statistics would understand.
Exercises 1
Refer to the data in Exercise 2, showing the frequency of coronary heart disease for men with no anger and men with the most anger. Show how the numbers in the following statement were calculated: The odds of remaining free of heart disease versus getting heart disease are about 24 to 1 for men with no anger, whereas those odds are only about 8.5 to 1 for men with the most anger.
Exercise 2
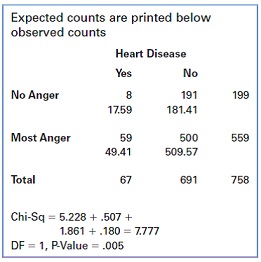
Exercise 2 concerned the relationship between anger and the risk of coronary heart disease. Some computer output for a chi-square test is shown below. What do the results indicate about the relationship? Explain.
Exercise 3
Do grumpy old men have a greater risk of having coronary heart disease than men who aren't so grumpy? Harvard Medical School researchers examined this question in a prospective observational study reported in the November 1994 issue of Circulation (Kawachi et al., 1994). For 7 years, the researchers studied men between the ages of 46 and 90. All study participants completed a survey of anger symptoms at the beginning of the study period. Among 199 men who had no anger symptoms, there were 8 cases of coronary heart disease. Among 559 men who had the most anger symptoms, there were 59 cases of coronary heart disease.
a. Construct a contingency table for the relationship between degree of anger and the incidence of heart disease.
b. Among those with no anger symptoms, what percentage had coronary heart disease?
c. Among those with the most anger symptoms, what percentage had coronary heart disease?
d. Draw a bar graph of these data. Based on this graph, does there appear to be an association between anger and the risk of coronary heart disease? Explain.
|
What intervention strategies might carole recommend
: When Jamie's mother, Arlene, attended the first-term Parent Teacher Association meeting, Carole, another parent who works as a case manager at a local community mental-health clinic, helped seat her. Over coffee after the PTA meeting, Arlene discl..
|
|
Prepare a presentation on sexual assault prevention program
: Prepare a presentation for the parents, providing pertinent information they might like to include in a Sexual Assault Prevention program aimed at the children in their community. Suggest the psychoeducational and supportive approaches that can be..
|
|
What percentage delivered before 42 weeks
: Which of the two variables that were used to make the contingency table is the explanatory variable, and which is the response variable?
|
|
Explain an individual in your community that you believe
: Identify an individual in your community that you believe to be leader. Contact the individual to determine if he / she will be able to participate in this project for school.
|
|
Degree of anger and the incidence of heart disease
: Construct a contingency table for the relationship between degree of anger and the incidence of heart disease.- Among those with no anger symptoms, what percentage had coronary heart disease?
|
|
Discuss about the professional portfolio-resume
: you will submit the first document to be included in your Professional Portfolio: Your resume (if you are seeking employment immediately upon graduation) or your curriculum vitae (if you are applying to graduate school). At the end of the documen..
|
|
What are business ramifications and government ramification
: What are the Business ramifications? Government ramifications? Society ramifications? Ethical ramifications? Environmental ramifications? Political ramifications? My position on the issue.
|
|
Prepare one-year strategic plan of action for organization
: Develop a 1-year strategic plan of action for your organization using lessons learned and your learning team activity during Week 1. Include plans for any additional staffing and the proposed budget for your plan.
|
|
Draw a bar graph of given data
: Draw a bar graph of these data. Based on this graph, does there appear to be an association between anger and the risk of coronary heart disease? Explain.
|