Design and develop a matlab simulink model of low voltage

Assignment Help Simulation in MATLAB
Reference no: EM133538564

Power Quality and Mitigation

Question:
A low voltage distribution network is facing voltage variation problem due to integration of renewable energy resources. It is required to improve operation and control of network by designing and implementing a distribution static synchronous compensator (D-STATCOM) for power quality improvement in asynchronous machine-based distributed generation as the asynchronous generator has poor voltage regulation specially, during peak load conditions.

You are required to design and develop a MATLAB Simulink model of Low voltage network for three-phase, 3-wire loads. The single line diagram of the network, D-STATCOM control design and required parameters are provided in Fig 1, Fig 2 and Table 1 respectively. Main system consists of grid, asynchronous machine with balanced /unbalanced load and D-STATCOM for voltage regulation purpose. A conversion distribution system of 25 kV; 1000 MVA, 50 Hz needs to operate along with an asynchronous generator and DSTATCOM.

443_Basic Structure of LV distribution system.jpg


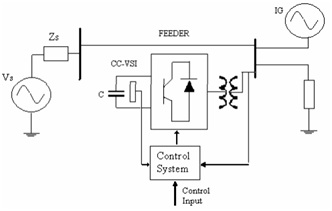
Fig 1: Basic Structure of LV distribution system

587_Basic Structure of LV distribution system1.jpg


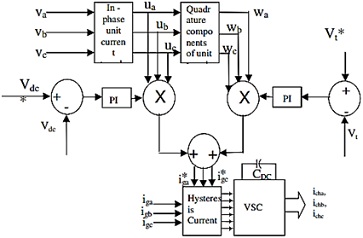
Fig 2: Control scheme of DSTATCOM

Table 1: Parameters for design of D-STATCOM based LV distribution system

Feeder System

25kV, 100MVA, 50 Hz, R= 0.625 ?, L= 0.0199 H

Induction machine

7.5kW, 415V, 50Hz, Y-connected, 4-pole

Rs = 1 Ω, Rr =0.77Ω , Xlr= Xls= 1.5Ω, J= 0.1384kg-m2

D-STATCOM

Lf = 4mH, Rf = 0.1?, and Cdc = 4000uF.

Kpa = 0.04, Kia = 0.0015. Kpd = 0.02, Kid = 0.001.

Prime Mover Characteristics

Tsh = K1-K2 Ar Where, K1 = 32000, K2 = 100

Task 1:
Check the load balancing aspect of STATCOM based voltage regulator system at 3-phase 3-wire balanced/unbalance resistive load condition. Three, single-phase load each of 2.5 kW is applied between each phase and neutral, and observe the magnitude of terminal voltage (vt) and DC link voltage (vdc).

Task 2:
Now replace the load with 3-phase 3-wire balanced/unbalance reactive load (at lagging 0.8 power factor) and check performance of network.

Reference no: EM133538564

Questions Cloud

Explain how the role of the board and the role of the ceo : Explain how the role of the board and the role of the CEO might clash or create conflict in an organization. Give me details on two specific conflicts
Identify a city eop : Identify a city's EOP and explain who is typically in charge of making decisions? What would happen if the main leadership were involved in an incident.
Describe different forms of collective behavior : Describe different forms of collective behavior. Discuss the pros and/or cons of homo sapiens (humans) effect on the earth and its inhabitants?
Explain how your thoughts on diversity will help you develop : Explain what diversity means to you. as a social worker Explain how your thoughts on diversity will help you develop plans for intervention and social work
Design and develop a matlab simulink model of low voltage : MEE607 Power Quality and Mitigation, Engineering Institute of Technology - design and develop a MATLAB Simulink model of Low voltage network for three-phase
Discusses different ways of organizing in latin america : discusses different ways of organizing in Latin America compared to the United States. Think of a social issue you are deeply against and do a reflection about
Discuss your view and understanding of the charter of rights : Discuss your view and understanding of the Charter of Rights and Freedoms plays in the Canadian legal system. In what ways do you think the Charter has changed
How does the theory explain human behavior : List the theories you found and provide a brief description of each one, choosing one theory to describe in detail. What are the key constructs of the theory?
What are some constraints-risks that a company : What are some constraints/ risks that a company need to consider and monitor while implementing change?

Reviews

Write a Review

Simulation in MATLAB Questions & Answers

  Calculate the stress intensity factor

Use the three-parameter zone finite element method or the boundary collocation method to calculate the stress intensity factor K, at the crack tip for the plate

  Build a simulation using newtons laws of motion

Build a new and different simulation of your own using Newtons laws of motion and Show the code and describe how it works

  Write the specification of load mover

Write the specification of LOAD MOVER detailed of the whole design and precise for automatic control section and divide the design into various modules and Is the kernel required if yes which one?

  Design the automatic control section using statecharts

Aim of this project is to design an embedded system which can move loads from one place to another. The system can be operated manually, automatically and wirelessly.

  Need an expert who can model a drill in simulink

Need an expert who can model a drill in Simulink. Working model of a drill needing for an improvment to behave more realistically as a drill to drill through plastic block.

  Project is on load frequency control using fpid

Project is on load frequency control using FPID tuned using GA and PSO algorithm and the system is a two area system.

  Number of packets received with time

Let x be the number of packets received with time -

  Build a matlab based graphical user interface

Build a Matlab based graphical user interface (GUI) that operates in conjunction with a base Matlab/ Simulink simulation program. Any base simulation is considered acceptable.

  Build a matlab based graphical user interface

Build a Matlab based graphical user interface (GUI) that operates in conjunction with a base Matlab/ Simulink simulation program. Any base simulation is considered acceptable.

  Simulate the standardised sum of independent

Simulate the standardised sum of independent and identically distributed variates - Fit a linear regression model as in Q5, and plot your estimates for β0 and β1 as N increases, together with a line indicating their true values. Supply your code.

  Plot the original periodic square wave

Plot the original periodic square wave on the same graph. Comment on the difference between the original periodic square wave and its truncated Fourier series presentation.

  Use matlab to plot the function

Plot the original periodic square wave on the same graph. Comment on the difference between the original periodic square wave and its truncated Fourier series presentation.

Free Assignment Quote

Assured A++ Grade

Get guaranteed satisfaction & time on delivery in every assignment order you paid with us! We ensure premium quality solution document along with free turntin report!

All rights reserved! Copyrights ©2019-2020 ExpertsMind IT Educational Pvt Ltd