Create an x-y graph of distance from the sun

Assignment Help Science
Reference no: EM131576655

Solar System and Nebular Hypothesis Lab

Adapted from Michael Stewart, 2006, downloaded from the SERC website

In this lab you will collect planetary data from the internet and evaluate those data in light of the nebular hypothesis. For this lab you will need to recall our lectures on the nebular hypothesis, and be familiar with Microsoft Excel.

Complete your answers to the questions on the final pages of this document, cut and paste your two X-Y plots from Excel into the bottom of this Word document and upload the complete file in Canvas.

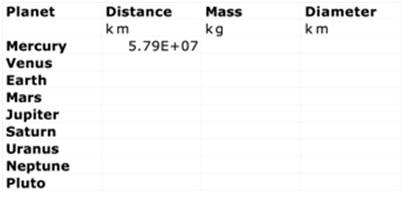
A) First, click on the following link or type the url into your browser. Record these data for each of the eight planets plus Pluto: Distance from Sun, Mass, Diameter and enter them into an Excel spreadsheet like so add another column after Diameter with Density and enter those data too.

Notice that distance and mass values are exceedingly large. Enter these numbers as scientific notation. For example a number like 15 million (15,000,000) is written as 1.5x10⁷ in scientific notation. Where the 7 is simply the number of decimal spaces to the right of the first digit. To enter 15 million as scientific notation in Excel, simply enter 1.5e7 and hit return.

Alternatively, simply type in 15000000 and hit return. Then highlight the cells you want displayed in scientific notation, click on the Format menu, choose ‘cell' and then click the ‘number' tab and select ‘scientific' from the list of options.

B) Create an X-Y graph of Distance from the Sun vs. Mass of the Planets. Notice how the first four planets (Mercury, Venus, Earth and Mars) are near the origin on this graph and except for Jupiter and Saturn, the other planets all lie nearly along the X-axis.

Thus, this is a terrible graph because it masks all information regarding trends in mass relative to distance. To construct a more informative graph, you will have to adjust the axes to plot on logarithmic scales.

Change the axes to logarithmic scale by clicking on each axis, choose the ‘scale' tab and check the ‘log scale' box. Do this for both axes and also change the ‘minimum' axis values (also in the Scale dialog box) as such: Distance minimum = 1x10⁷km, and Mass minimum = 1x10²²kg.

D) Create an X-Y graph of Distance from the Sun vs. Density of the Planets. Here, only the distance need be expressed on a logarithmic scale.

E) Answer the following questions. Please put your name in the space below to help me keep track.

1. Compare the diameter of the smallest Jovian planet to the largest Terrestrial Planet. Express this quantitatively (e.g. as a percentage, or ratio).

2. How does mass of the planets vary with distance from the Sun?

3. How does density of the planets vary with distance from the Sun?

4. Explain why mass and density of the planets vary with distance from the Sun. Recall our discussion of the nebular hypothesis and pay particular attention to the solar winds during the early stages of the solar system, the thermal gradient across the solar system, and the materials (volatile vs. refractory) that compose the planets.

5. How does the mass and density of Pluto compare to the trends you observed in questions 2 and 3 above?

Paste your two X-Y plots from Excel here.

1054_image.jpg

Reference no: EM131576655

Questions Cloud

Find a spanning tree for the graph : Find a spanning tree for the graph shown by removing edges in simple circuits.
Differentiate among paid-owned and earned media : 1. Differentiate among paid, owned, and earned media. Give a specific example of each of the following types of media for Coca-Cola:
Essay has an effective conclusion that summarizes the paper : Ideas in the paper are ordered logically with appropriate topic sentences beginning each paragraph
Using single overhead rate based on direct labor : Overhead assigned to Flacca using a single overhead rate based on direct labor hours and using ABC, respectively, would be:
Create an x-y graph of distance from the sun : Create an X-Y graph of Distance from the Sun vs. Density of the Planets. Here, only the distance need be expressed on a logarithmic scale.
Write a program using milnes formula : Write a program using Milne's formula for integrating a differential equation with equally spaced points. Assume that the first three starting values are known.
What is the profit to investment bank : how much money does Looney Landscaping Corp. receive? What is the profit to the investment bank?
What are the trial balance totals of the debits and credits : Given the following list of accounts with normal balances, what are the trial balance totals of the debits and credits
The sarbanes-oxley act : The Sarbanes-Oxley (SOX) Act was enacted in 2002 for companies in the private sector as a result of the Enron and other scandals.

Reviews

Write a Review

Science Questions & Answers

  Journal of pharmaceutical sciences

This journal is a scientific publication of Indian Pharmaceutical Association and highlights various bright points of it.

  Optical fibres

This document discuss about the main attributes and characteristics of optical fibres.

  Micro organisms

This project report reveals the fact and proves a specific objective mentioned to be studied upon.

  Describing histology of an organ

The discussion of the technique should include a literature review on the evolution of the technique.

  Interpret the sensitivity of mammography

Calculate and interpret the sensitivity of mammography. Diagnostic test with Sensitivity 50%, Specificity 50% and prevalence 50%. Crude mortality rate. Damage caused by motor vehicle accidents.

  Discuss the role that science plays in your daily life

Role that science plays in your daily life and Integrity, Intensity, Innovation, and involvement in scientific field

  Prepare a flexible budget gator divers

Prepare a Flexible Budget Gator Divers is a company that provides diving services such as underwater ship repairs to clients in the Tampa Bay area.

  Neurological disorders

Designing a neuroprosthesis for the neurological disorders

  Complexity of cell surfaces

Lipid rafts provide another example of the complexity of cell surfaces in both their structural character and biologic functionality. Please explain the nature of these structures and their functionality.

  Exploratory activity on bird beaks

Describe how natural selection and evolution are demonstrated by this activity

  Spatial and temporal variation of heat content in the upper

In this study the temporal and spatial variation of heat content in the upper 70m layer of the Arabian Sea was for a period of 1991 to 2008 have been attempted.

  Earthquake databases

Earthquake Databases

Free Assignment Quote

Assured A++ Grade

Get guaranteed satisfaction & time on delivery in every assignment order you paid with us! We ensure premium quality solution document along with free turntin report!

All rights reserved! Copyrights ©2019-2020 ExpertsMind IT Educational Pvt Ltd