Reference no: EM131359489
Group Project: Applying the 5-Step Hypothesis Testing Model
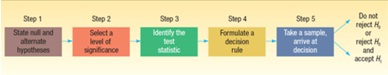
Figure 1. Five-Step Procedure for Testing a Hypothesis (Lind, 2013, p. 329)
Project Description
For this project, you will work in small groups to create a research scenario that employs the five-step hypothesis testing model. If the class has an even number of students, groups will be 2 students. If the class has an odd number of students, groups may be 2 or 3 students. In either case, all students must be in a group, no individual projects will be accepted.
Choose a research setting or scenario that will be conducive to collecting basic statistical data. This could be your respective work places, or a mutually agreed upon setting. Decide what type of data will be collected and create an instrument to collect the data.
Apply the 5-step process as noted above. Be sure each of the steps is accompanied by an explanation as to how and why decisions were made regarding that step. For example, if you choose .05 as your level of significance, explain how that decision impacts your study and why (based on scholarly research) it was selected.
Weekly Instructions
Week 2 The group project assignment for this week is to select your partner(s) for the project and complete the Group Project Charter. Submit a copy of the template with all required information to the group assignment tab.
Week 3 During Week 3 of the group project, you will decide on your research scenario, what data to be collected, and a data collection tool. The research scenario should be one or more sites where data can be collected easily and with the least amount of disruption to the organization. The type of data to be collected should include scale variables (numbers) rather than just nominal data (yes/no, male/female). The data collection tool should be simple, but detailed enough to obtain statistical information that will be useful in your calculations.
Week 4 In Week 4, you will collect data and execute Steps 1-4 of Hypothesis Testing Model.
Week 5 In Week 5, you will present the results of your research in a document not to exceed 3 pages (Step 5 of the Hypothesis Testing Model). Include setting/scenario for the data collection, the data collection tool, and the 5-step hypothesis testing results. This paper should be accompanied by a creative presentation as well (PowerPoint, video, etc.) that describes the research scenario and results.
You will submit an initial draft of your project to a peer review board by Wednesday then incorporate any suggestions to improve your final product for submission on Sunday.
Other details
- All writing should conform to APA standards.
- Scholarly research should be cited and referenced correctly in support of the research conducted.
- Paper should be in Times Roman or Arial, 12-point font, double-spaced.
- A cover page and Reference list should be included, but these will not be included in the page count.
|
Find the active reactive and apparent power
: Suppose the motor is supplied from a 440-V source through a feeder whose impedance is 0.5 + j0.3 ohm per phase.
|
|
Level of training than an organization implements
: Those who can leverage their talent better than their competition will have a significant advantage. Identify how business strategies influence the level of training than an organization implements.
|
|
Determine the input power and power factor
: Consider the transmission link of Problem 2.2 and choose 100 kVA and 2300 V as base kVA and voltage. Determine the input power in per unit under the conditions of Problem 2.2.
|
|
Examine the pros and cons of a sinking fund from viewpoint
: Examine the pros and cons of a sinking fund from the viewpoint of both a firm and its bondholders. Determine the fundamental manner in which this knowledge could be helpful to a financial manager. Provide a rationale for your response.
|
|
Create a research scenario that employs
: Create a research scenario that employs the five-step hypothesis testing model. If the class has an even number of students, groups will be 2 students. If the class has an odd number of students, groups may be 2 or 3 students. In either case, all ..
|
|
What are the goals of employee selection
: In 200 - 250 words, what are the goals of employee selection? Compare and contrast two selection methods and how these selection methods impact the achievement of organizational objectives?
|
|
Find the corresponding base impedance and va
: In the circuit shown in Figure 2.35, the source phasor voltage is V = 30∠15°. Determine the phasor currents I2 and I3 and the impedance Z2. Assume that I1 is equal to five A. Calculate the apparent power produced by the source and the individual ap..
|
|
Write an academic report about current of stock markets
: Write an academic report about current and future of stock markets regulatory business model and its mainly (UAE sca - securities & commodities authority ) business model and future changes and sustainability plan.
|
|
Shift in competitive strategy
: Determine how Sportsman's human resources practices should assess existing practices to best support their shift in competitive strategy. Provide specific examples to support your response.
|