Create a new spreadsheet named final-xlsx

Assignment Help Basic Computer Science
Reference no: EM131082117

Slide 1

Open PowerPoint. Create a new presentation. For the opening slide, type "CS 120 Final Exam Term Year" as the title. Term being Winter/Fall/Spring. Put your name as the subtitle. Use any formatting or style you wish. You are done with slide 1. The content for the next four slides will created in Word, Excel and Access. The specifications for these slides are provided below. Save your presentation as final.pptx.

Slide 2 Microsoft Excel

Open Excel. Create a new spreadsheet named final.xlsx. Enter the following data into the worksheet. Enter numbers exactly as you see them. The first row is a heading that should merge across all six columns.

Sales Summary

Order No.

Wt. (Ibs)

Price

Tax

Shipping

Total

001

100

20.98


002

140

10.36


003

200

8.29


004

95

17.33


To complete your worksheet, add the following:

1. Enter a formula to compute the tax on each order (Price * 0.07). Format the values as 'Currency'.
2. Use the IF function to find the shipping charge. If the weight is more than 125 pounds the shipping charge is $1.00 per pound (1.00 * pounds). Otherwise it is $0.75 per pound (.75 * pounds).
3. Use either a function or a formula to find the total cost of each order.
4. Display the numbers in the Tax, Shipping, and Total columns with two decimal places.
5. Make the title bold and increase the font size of it.
6. Sort the data by descending 'Order No.'.

Return to your PowerPoint presentation. Insert a new slide. Copy and paste your finished Excel table into the slide. You are done with slide 2.

Slide 3

Return to Excel. In the same Excel workbook, rename Sheet 2 as Exercise 2 and enter the following data on the Exercise 2 sheet.
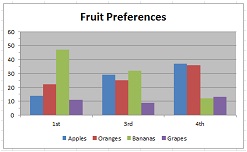
Fruit Preferences

Grade

1st

3rd

4th

Apples

14

29

37

Oranges

22

25

36

Bananas

47

32

12

Grapes

11

9

13

Using the above data, make a Bar Chart. Save it on the same sheet as the data. Resize the chart if necessary to make the legends and titles clearly visible. When finished, it should look like the chart below.

2356_Fruit Preferences Bar Chart.jpg

Return to your PowerPoint presentation. Insert a new 'Title Only' slide. For the slide title, enter your name. Copy and paste your Excel Bar Chart into the slide. You are done with slide #3. Save your worksheet in case you need to create your slide again.

Slide 4 Acess

Import these files into your Access Database

Open Access. Create a blank database named final.accdb. Import the tables from above and name them Students, GPA, & Major. The data files you downloaded are comma delimited files (CSV) or tab delimited. The three files represent tables for Students, a table for their major, and a table for their GPA.

Create a query that selects all of the history majors and their GPA.

Now create a report with all of the students in the History department with a GPA greater than or equal to 3.50. You will have the following fields in the given order 'Last', 'First', 'Department', & 'GPA'. Hint: put >= in the GPA Criteria field when in the query design view. Order the table from highest to lowest GPA.

Make the report fit on one page and make it look neat. So shorten up the text boxes put a title, remove the time from the header and reformat the date to mm/dd/yyyy.

Return to your PowerPoint presentation. Insert a new slide. Paste your report on this slide. You are done with slide #4.

Slide 5

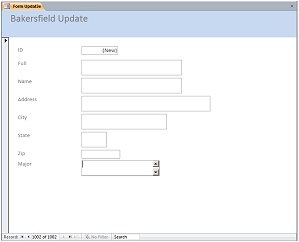
Create a form for the 'Students' table using the 'Form Wizard' from the ribbon. Update all of the fields using one form. The form should look like the one below and in that order. TITLE YOUR FORM 'Bakersfield Students Data Update'. Take a screen shot of your form and insert it into slide #5. (See the 'Addendum' below that uses 'Paint' to do the screen capture, Google it, or use your favorite program to capture screen images and edit them. The TA can also help. Also you can take a picture with your phone and attach that.

1279_Students Table Form.jpg

Slide 6

Using the above form add five entries where the 'City' is equal to 'Bakersfield'. Leave the first field alone it will populate on its own. Use fictional data for the other fields. Remember the zip has to be numbers. Select only the cities that match 'Bakersfield'. Create a report with only the Bakersfield entries. Make the report look nice and copy it to the PowerPoint presentation as slide #6

Attachment:- Attachments.rar

Reference no: EM131082117

Questions Cloud

Cost leadership is perhaps less relevant for firms : Although cost leadership is perhaps less relevant for firms pursuing product differentiation, costs are not totally irrelevant. What advice about costs would you give a firm pursuing a product-differentiation strategy?  What is the role of costs in a..
Principles of materiality and principles : Explain the principles of materiality and principles of full disclosure. Explain why? These two principles are contradicting each other. Your answer shouldbe substantiated with relevant examples.
Major factors that affect economic development : Researchers have come to conclusion that corruption is one of the major factors that affect the economic development in many developing countries. In other words, these countries are not developed because of corruption. What is your reaction to this ..
Probability p[w] that the operation is successfull : Sketch a block diagram for this operation similar to those of Figure 1.3 on page 38. What is the probability P[W] that the operation is successful?
Create a new spreadsheet named final-xlsx : Create a new spreadsheet named final.xlsx. Enter the following data into the worksheet. Enter numbers exactly as you see them. The first row is a heading that should merge across all six columns.
Effective higher interest elasticity of investment demand : Explain the relationship between the effectiveness of monetary policy and the interest elasticity of investment. Will monetary policy be more or less effective the higher the interest elasticity of investment demand? Explain. Now explain the relation..
What is the probability that both photo detectors in a pair : What is the probability that both photo detectors in a pair are defective?
Integrate traditional marketing approaches : 1. How do we integrate traditional marketing approaches with digital marketing? 2. How can we use electronic communications to differentiate our products and services?
What is p[h1h2] are h1 and h2 independent : What is P[H1H2]? Are H1 and H2 independent?

Reviews

Write a Review

Basic Computer Science Questions & Answers

  Assignment on modeling a game using turing machine

Modeling a Game Using Turing Machine, Select a game that can be modeled by a simple Turing machine. It should take a series of inputs (such as a set of moves by a player) and use the tape and table to compute the outcome of whether the player won ..

  Design program calculates the total amount meals purchased

Design a program that calculates the total amount of a meal purchased at a restaurant.

  Write program that prompts user to pick either seat or price

Write a program that prompts users to pick either a seat or a price. Mark sold seats by changing the price to 0. When a user specifies a seat, make sure it is available.

  Determining the maximize profit

Determine how many items you need to sell to maximize profit (note that Profit = Revenue - Cost and Revenue = Quantity times the price per item.

  Define multitasking and real-time terms of embedded system

Define, in your own words, "multitasking" and "real-time" in terms of embedded system

  Briefly describe the data collection techniques

Briefly describe the data collection techniques. Did the researcher use appropriate data collection techniques (qualitative and/or quantitative) to answer the study's research questions

  Create 2 employee objects.

employee class with auto property or instance variable . create 2 employee objects.

  Conduct observation used in business or organization

Conduct the observation to someone involved in procedure which is used in a business or organization. This person could be someone at university, in small business in your neighborhood.

  Analyze use of digital signatures to validate device drivers

Analyze the use of digital signatures to validate device drivers. Describe a situation where it is necessary to bypass this protection. Justify your response.

  How implement memory allocation with strings

how implement memory allocation with strings.

  Find monthly break-even volume for company

Variable cost per pound of fertilizer is $0.15. Evergreen sells fertilizer for $0.40 per pound. Find out the monthly break-even volume for company.

  The debate between utilizing paper or plastic in the retail

The debate between utilizing paper or plastic in the retail market has and will always be around. The majority of grocery stores offer you the choice of paper or plastic, and some stores are even moving towards a more environmental friendly reusable ..

Free Assignment Quote

Assured A++ Grade

Get guaranteed satisfaction & time on delivery in every assignment order you paid with us! We ensure premium quality solution document along with free turntin report!

All rights reserved! Copyrights ©2019-2020 ExpertsMind IT Educational Pvt Ltd