Reference no: EM132245000
Applied Statistics Assignment - Problems set
Q1. Suppose there are n independent trials of an experiment with k > 3 mutually exclusive outcomes, where pi represents the probability of observing the ith outcome. What would be the formula of an expected count in this situation? Choose the correct answer below.
A. The expected counts for each possible outcome are given by Ei = n.
B. The expected counts for each possible outcome are given by Ei = pi.
C. The expected counts for each possible outcome are given by Ei = npi.
D. The expected counts for each possible outcome are given by Ei = n/Pi.
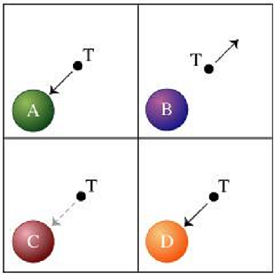
Q2. Determine (a) the χ2 test statistic, (b) the degrees of freedom, (c) the critical value using α = 0.05, and (d) test the hypothesis at the α = 0.05 level of significance.
|
Outcome
|
A
|
B
|
C
|
D
|
|
Observed
|
21
|
19
|
18
|
22
|
|
Expected
|
20
|
20
|
20
|
20
|
H0: pA = pB = pC = pD = ¼
H1: At least one of the proportions is different from the others.
(a) The test statistic is _______.
(b) There are _______ degrees of freedom.
(c) The critical value is ________. (Round to three decimal places as needed.)
(d) Should the null hypothesis be rejected?
A. No because χ20 is less than or equal to χ20.05.
B. No because χ20 is greater than χ20.05.
C. Yes because χ20 is less than or equal to χ20.05.
D. Yes because χ20 is greater than χ20.05.
Q3. A manufacturer of colored candies states that 13% of the candies in a bag should be brown, 14% yellow, 13% red, 24% blue, 20% orange, and 16% green. A student randomly selected a bag of colored candies. He counted the number of candies of each color and obtained the results shown in the table. Test whether the bag of colored candies follows the distribution stated above at the α = 0.05 level of significance.
Observed Distribution of Colors -
|
|
Colored Candies in a bag
|
|
Color
|
Brown
|
Yellow
|
Red
|
Blue
|
orange
|
Green
|
|
Frequency
|
62
|
66
|
52
|
60
|
88
|
66
|
|
Claimed Proportion
|
0.13
|
0.14
|
0.13
|
0.24
|
0.20
|
0.16
|
Determine the null and alternative hypotheses. Choose the correct answer below.
A. H0: The distribution of colors is the same as stated by the manufacturer.
H1: The distribution of colors is not the same as stated by the manufacturer.
B. H0: The distribution of colors is not the same as stated by the manufacturer.
H1: The distribution of colors is the same as stated by the manufacturer.
C. None of these.
Compute the expected counts for each color.
|
Color
|
Frequency
|
Expected Count
|
|
Brown
|
62
|
|
|
Yellow
|
66
|
|
|
Red
|
52
|
|
|
Blue
|
60
|
|
|
Orange
|
88
|
|
|
Green
|
66
|
|
(Round to two decimal places as needed.)
What is the test statistic?
χ20 = ______ (Round to three decimal places as needed.)
What is the P-value of the test?
P-value = ______ (Round to three decimal places as needed.)
Based on the results, do the colors follow the same distribution as stated in the problem?
A. Do not reject H0. There is not sufficient evidence that the distribution of colors is not the same as stated by the manufacturer.
B. Reject H0. There is not sufficient evidence that the distribution of colors is not the same as stated by the manufacturer.
C. Reject H0. There is sufficient evidence that the distribution of colors is not the same as stated by the manufacturer.
D. Do not reject H0. There is sufficient evidence that the distribution of colors is not the same as stated by the manufacturer.
Q4. The first significant digit in any number must be 1, 2, 3, 4, 5, 6, 7, 8, or 9. It was discovered that first digits do not occur with equal frequency. Probabilities of occurrence to the first digit in a number are shown in the accompanying table. The probability distribution is now known as Benford's Law. For example, the following distribution represents the first digits in 221 allegedly fraudulent checks written to a bogus company by an employee attempting to embezzle funds from his employer.
Distribution of First Digits - Full data set
|
Distribution of first digits (Benford's Law)
|
|
Digit
|
1
|
2
|
3
|
4
|
5
|
6
|
7
|
8
|
9
|
|
Probability
|
0.301
|
0.176
|
0.125
|
0.097
|
0.079
|
0.067
|
0.058
|
0.051
|
0.046
|
|
First digits in allegedly fraudulent checks
|
|
First digit
|
1
|
2
|
3
|
4
|
5
|
6
|
7
|
8
|
9
|
|
Frequency
|
42
|
32
|
28
|
26
|
24
|
36
|
9
|
17
|
7
|
(1) 0.05.
0.10.
0.01.
Complete parts (a) through (c) below.
(a) Because these data are meant to prove that someone is guilty of fraud, what would be an appropriate level of significance when performing a goodness-of-fit test?
Use α = (1) _____
(b) Using the level of significance chosen in part (a), test whether the first digits in the allegedly fraudulent checks obey Benford's Law. Do the first digits obey Benford's Law?
What are the null and alternative hypotheses?
A. H0: The distribution of the first digits in the allegedly fraudulent checks does not obey Benford's Law.
H1: The distribution of the first digits in the allegedly fraudulent checks obeys Benford's Law.
B. H0: The distribution of the first digits in the allegedly fraudulent checks obeys Benford's Law.
H1: The distribution of the first digits in the allegedly fraudulent checks does not obey Benford's Law.
What is the test statistic?
χ20 = _______
What is the P-value of the test?
P-value = ______
Using the P-value approach, compare the P-value with the given α = 0.01 level of significance. Based on the results, do the first digits obey Benford's Law?
A. Do not reject the H0 because the calculated P-value is less than the given α level of significance.
B. Reject the H0 because the calculated P-value is greater than the given α level of significance.
C. Reject the H0 because the calculated P-value is less than the given α level of significance.
D. Do not reject the H0 because the calculated P-value is greater than the given α level of significance.
(c) Based on the results of part (b), could one think that the employee is guilty of embezzlement?
A. No, the first digits obey Benford's Law.
B. Yes, the first digits do not obey Benford's Law.
C. Yes, the first digits obey Benford's Law.
D. No, the first digits do not obey Benford's Law.
Q5. A traffic safety company publishes reports about motorcycle fatalities and helmet use. In the first accompanying data table, the distribution shows the proportion of fatalities by location of injury for motorcycle accidents. The second data table shows the location of injury and fatalities for 2037 riders not wearing a helmet.
Distribution of fatalities by location of injury -
|
Proportion of fatalities by location of injury for motorcycle accidents
|
|
Location of injury
|
Multiple locations
|
Head
|
Neck
|
Thorax
|
Abdomen/ Lumbar/Spine
|
Full data set
|
|
Proportion
|
0.570
|
0.310
|
0.030
|
0.060
|
0.030
|
|
|
Location of injury and fatalities for 2037 riders not wearing a helmet
|
|
Location of injury
|
Multiple locations
|
Head
|
Neck
|
Thorax
|
Abdomen/ Lumbar/ Spine
|
|
Number
|
1025
|
850
|
32
|
84
|
46
|
Complete parts (a) and (b) below.
(a) Does the distribution of fatal injuries for riders not wearing a helmet follow the distribution for all riders? Use α = 0.05 level of significance. What are the null and alternative hypotheses?
A. H0: The distribution of fatal injuries for riders not wearing a helmet does not follow the same distribution for all other riders.
H1: The distribution of fatal injuries for riders not wearing a helmet does follow the same distribution for all other riders.
B. H0: The distribution of fatal injuries for riders not wearing a helmet follows the same distribution for all other riders.
H1: The distribution of fatal injuries for riders not wearing a helmet does not follow the same distribution for all other riders.
C. None of these.
Compute the expected counts for each fatal injury.
|
Location of injury
|
Observed Count
|
Expected Count
|
|
Multiple Locations
|
1025
|
|
|
Head
|
850
|
|
|
Neck
|
32
|
|
|
Thorax
|
84
|
|
|
Abdomen/Lumbar/Spine
|
46
|
|
(Round to two decimal places as needed.)
What is the P-value of the test?
P-value = ____
Based on the results, does the distribution of fatal injuries for riders not wearing a helmet follow the distribution for all other riders at a significance level of α = 0.05?
A. Reject H0. There is sufficient evidence that the distribution of fatal injuries for riders not wearing a helmet does not follow the distribution for all riders.
B. Do not reject H0. There is sufficient evidence that the distribution of fatal injuries for riders not wearing a helmet follows the distribution for all riders.
C. Reject H0. There is not sufficient evidence that the distribution of fatal injuries for riders not wearing a helmet follows the distribution for all riders.
D. Do not reject H0. There is not sufficient evidence that the distribution of fatal injuries for riders not wearing a helmet does not follow the distribution for all riders.
(b) Compare the observed and expected counts for each category. What does this information tell you?
A. Motorcycle fatalities from thorax injuries occur more frequently for riders not wearing a helmet.
B. Motorcycle fatalities from head injuries occur more frequently for riders not wearing a helmet.
C. Motorcycle fatalities from head injuries occur less frequently for riders not wearing a helmet.
Q6. The data in the accompanying table represent the number of corn plants in randomly sampled rows (a 17-foot by 5-inch strip) for various types of plots. An agricultural researcher wants to know whether the mean numbers of plants for each plot type are equal.
|
Corn Plants
|
|
Sludge Plot
|
Spring Disk
|
No Till
|
|
25
|
33
|
30
|
|
26
|
30
|
27
|
|
35
|
33
|
30
|
|
29
|
35
|
32
|
|
27
|
34
|
25
|
|
28
|
32
|
28
|
Table of critical values for the correlation coefficient critical values for normality.
|
Sample Size, n
|
Critical Value
|
|
5
|
0.880
|
|
6
|
0.888
|
|
7
|
0.898
|
|
8
|
0.906
|
|
9
|
0.912
|
|
10
|
0.918
|
|
11
|
0.923
|
|
12
|
0.928
|
|
13
|
0.932
|
|
14
|
0.935
|
|
15
|
0.939
|
|
16
|
0.941
|
|
17
|
0.944
|
|
18
|
0.946
|
|
19
|
0.949
|
|
20
|
0.951
|
|
21
|
0.952
|
|
22
|
0.964
|
|
23
|
0.956
|
|
24
|
0.957
|
|
25
|
0.959
|
|
30
|
0.960
|
(1) Reject
Do not reject
(2) sufficient
insufficient
Complete parts (a) through (e) below.
(a) Write the null and alternative hypotheses. Choose the correct answer below.
A. H0: μsludge = μspring and H1: the means are different.
B. H0: at least one of the means is different and H1: μsludge = μspring = μno till
C. H0: μsludge = μspring = μno till and H1: at least one of the means is different
D. H0: μsludge = μspring = μno till and H1: μsludge < μspring < μno till
(b) State the requirements that must be satisfied to use the one-way ANOVA procedure. Select all that apply.
A. The k samples must be independent of each other.
B. The populations must have the same mean.
C. There must be k simple random samples, one from each of k populations.
D. The populations must have the same variance.
E. The populations must be normally distributed.
F. There must be k simple random samples, each from the same population.
(c) Use the following one-way ANOVA table to test the hypothesis of equal means at the α = 0.05 level of significance.
|
One-way ANOVA: Sludge Plot, Spring Disk, No Till
|
|
Source
|
DF
|
SS
|
MS
|
F
|
P
|
|
Factor
|
2
|
75.44
|
37.72
|
5.17
|
0.02
|
|
Error
|
15
|
109.5
|
7.3
|
|
|
|
Total
|
17
|
184.94
|
|
|
|
Should the null hypothesis be rejected?
(1) _______H0; there is (2) _________ evidence to conclude that the mean numbers of plants for each plot type are not equal.
(d) Shown are side-by-side boxplots of each type of plot. Do these boxplots support the results obtained in part (c)? Choose the correct answer below.
A. Yes, because the boxplots show that at least one of the means is significantly different.
B. Yes, because the boxplots show that the means are not significantly different.
C. No, because the boxplots do not show that at least one of the means is significantly different.
D. No, because the boxplots show that all of the means are significantly different.
(e) Verify that the residuals are normally distributed.
The normal probability plot and linear correlation coefficient, r, is shown on the right.
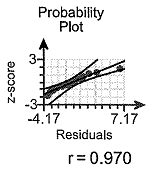
How does the normal probability plot of the residuals show that the residuals are normally distributed?
A. The plot is not linear enough, because r is less than the critical value.
B. The plot is linear enough, because r is less than the critical value.
C. The plot is linear enough, because r is greater than the critical value.
D. The plot is not linear enough, because r is greater than the critical value.
E. There is at least one outlier.
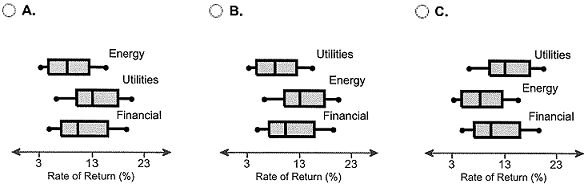
Q7. A stock analyst wondered whether the mean rate of return of financial, energy, and utility stocks differed over the past 5 years. He obtained a simple random sample of eight companies from each of the three sectors and obtained the 5-year rates of return shown in the accompanying table (in percent).
Rates of Return
|
Financial
|
Energy
|
Utilities
|
|
10.73
|
12.72
|
11.88
|
|
15.05
|
13.96
|
5.86
|
|
17.01
|
6.33
|
13.46
|
|
5.03
|
11.19
|
9.82
|
|
19.59
|
18.79
|
3.95
|
|
8.21
|
20.73
|
3.44
|
|
10.45
|
9.60
|
7.11
|
|
6.52
|
17.40
|
15.70
|
(1) is
is not
(2) can
cannot
Complete parts (a) through (d) below.
(a) State the null and alternative hypotheses. Choose the correct answer below.
A. H0: μfinancial = μenergy = μutilities and H1: μfinancial < μenergy < μutilities
B. H0: at least one of the means is different and H1: μfinancial = μenergy = μutilities
C. H0: μfinancial = μenergy = μutilities and H1: at least one of the means is different
D. H0: µfinancial = μenergy and H1: the means are different
(b) Normal probability plots indicate that the sample data come from normal populations. Are the requirements to use the one-way ANOVA procedure satisfied?
A. No, because the largest sample standard deviation is more than twice the smallest sample standard deviation.
B. Yes, because there are k = 3 simple random samples, one from each of k populations, the k samples are independent of each other, and the populations are normally distributed and have different variances.
C. Yes, because there are k = 3 simple random samples, one from each of k populations, the k samples are independent of each other, and the populations are normally distributed and have the same variance.
D. No, because there are k = 3 simple random samples, one from each of k populations, the k samples are independent of each other, and the populations are normally distributed and have the same variance.
(c) Are the mean rates of return different at the α = 0.05 level of significance?
Use technology to find the F-test statistic for this data set.
F0 = ________(Round to two decimal places as needed.)
Determine the P-value and state the appropriate conclusion below.
Since the P-value is ________, there (1) ________ enough evidence to reject the null hypothesis. Thus, we (2) ________ conclude that the mean rates of return are different at the α = 0.05 level of significance. (Round to three decimal places as needed.)
(d) Draw boxplots of the three sectors to support the results obtained in part (c). Choose the correct graph below.
Q8. A highway safety institution conducts experiments in which cars are crashed into a fixed barrier at 40 mph. In the institute's 40-mph offset test, 40% of the total width of each vehicle strikes a barrier on the driver's side. The barrier's deformable face is made of aluminum honeycomb, which makes the forces in the test similar to those involved in a frontal offset crash between two vehicles of the same weight, each going just less than 40 mph. You are in the market to buy a family car and you want to know if the mean head injury resulting from this offset crash is the same for large family cars, passenger vans, and midsize utility vehicles (SUVs). The data in the accompanying table were collected from the institute's study.
Head Injuries
|
Large Family Cars
|
Passenger Vans
|
Midsize Utility Vehicles (SUVs)
|
|
267
|
148
|
223
|
|
134
|
237
|
216
|
|
413
|
341
|
188
|
|
534
|
692
|
307
|
|
148
|
552
|
355
|
|
623
|
465
|
556
|
|
164
|
325
|
401
|
(1) insufficient
sufficient
(2) can
cannot
Complete parts (a) through (d) below.
(a) State the null and alternative hypotheses.
A. H0: μCars = μVans = μSUVs and H1: all means are different
B. H0: μCars = μVans = µSUVs and H1: μCars < μVans < μSUVs
C. H0: μCars = μVans = μSUVs and H1: at least one mean is different
(b) Normal probability plots indicate that the sample data come from normal populations. Are the requirements to use the one-way ANOVA procedure satisfied?
A. No, because the largest sample standard deviation is more than twice the smallest sample standard deviation.
B. No, because the samples are not independent.
C. No, because the populations are not normally distributed.
D. Yes, all the requirements for use of a one-way ANOVA procedure are satisfied.
(c) Test the hypothesis that the mean head injury for each vehicle type is the same at the α = 0.01 level of significance. Use technology to find the F-test statistic for this data set.
F0 = ______ (Round to three decimal places as needed.)
Determine the P-value and state the appropriate conclusion below.
Since the P-value is _______, there is (1) ________ evidence to reject the null hypothesis. Thus, we (2) ______ conclude that the means are different at the α = 0.01 level of significance. (Round to four decimal places as needed.)
(d) Draw boxplots of the three vehicle types to support the results obtained in part (c). Choose the correct graph below.
Q9. An engineer wants to know if the mean strengths of three different concrete mix designs differ significantly. He randomly selects 9 cylinders that measure 6 inches in diameter and 12 inches in height in which mixture A is poured, 9 cylinders of mixture B, and 9 cylinders of mixture C. After 28 days, he measures the strength (in pounds per square inch) of the cylinders. The results are presented in the accompanying table.
Data Table
|
Mixture A
|
Mixture B
|
Mixture C
|
|
3,960
|
4,090
|
4,070
|
4,120
|
4,180
|
3,820
|
|
4,040
|
3,830
|
4,350
|
4,640
|
3,820
|
3,750
|
|
3,790
|
3,940
|
4,620
|
4,190
|
4,010
|
3,990
|
|
3,850
|
4,080
|
3,730
|
3,850
|
4,150
|
4,320
|
|
3,990
|
|
4,890
|
|
4,190
|
|
(a) State the null and alternative hypotheses. Choose the correct answer below.
A. H0: μA = μB = μC and H1: at least one of the means is different.
B H0: at least one of the means is different and H1: μA = μB = μC
C. H0: µA = μB = μC and H1: μA < μB < μC
D. H0: μA = μB and H1: the means are different.
(b) Explain why we cannot use one-way ANOVA to test these hypotheses. Choose the correct answer below.
A. Because the samples are not random.
B. Because the samples are not independent of each other.
C. Because populations are not normally distributed.
D. Because the standard deviation for mixture B is more than two times larger than the standard deviation for mixture A.
Q10. What are the requirements to perform a one-way ANOVA? Is the test robust?
What are the requirements to perform a one-way ANOVA? Select all that apply.
A. The populations must have the same variance; that is, each treatment group has population variance σ2.
B. The sample means must all be equal.
C. There must be k simple random samples, one from each of k populations or a randomized experiment with k treatments.
D. The sample size for each of the k samples must be equal.
E. The populations must be normally distributed.
F. The within-sample variability must be less than the combined variances of each group.
G. The k samples must be independent of each other; that is, the subjects in one group cannot be related in any way to subjects in a second group.
Is the one-way ANOVA test robust?
A. Yes, small departures from the normality requirement do not significantly affect the results.
B. Yes, outliers in the data do not significantly affect the results.
C. No, small departures from the normality requirement significantly affect the results.
D. No, outliers in the data.