Reference no: EM133762761
Optimization in Engineering Design
Mathematical and MATLAB preliminaries:
Question 1) Consider the following function: f(x) = x12 + 4x1 - 3x32 + 4x1x3 - sin (3x2)
Determine the Gradient and Hessian of the above function, f(x), by hand, expressed in algebraic form.
Compute the gradient vector and Hessian matrix analytically when
Compute the gradient vector and Hessian matrix numerically, using second-order accurate finite difference (central difference) formulae, at the same point. Use a step size of 0.01 along each axis.
Determine if the Hessian (computed analytically) is positive/negative (semi) definite or indefinite, at the above stated value of (x1, x2, x3).
You can use MATLAB for this purpose
Determine the stationary points of the above function, f (x), by hand.
Question 2) Imagine x represents the energy efficiency of a product being manufactured and y represents the cost of manufacturing the product. Write a MATLAB script to do the following set of operations generate 100 random points (use the command "rand") in 2D space, and assume every point Pi →(xi, yi) in the set represents the (efficiency, cost) of a candidate product design.
identify all those product designs in the set which are inferior than at least one other design (in that set) in terms of both cost and efficiency. Classify those identified (say inferior) products or points into subset A. Classify the remaining products or points (say the superior ones) into subset B.
Plot all the points on a 2D scatter plot. Use the "X" symbol for the points in subset A and the "Cr symbol for the points in subset B. Clearly label your plot.
Run the above script three times, thereby generating three plots.
Along with the plots, in your report, (based on your observation) comment on the geometric nature of the points in subset A compared to those in subset B.
[Note: This is a basic exercise in algorithmic thinking and structured programming. Hint - consider writing a MA TLAB function to perform the pair wise comparison of points in terms of cost and efficiency, returning I of 3 potential outcomes.]
Graphical Solution:
Question 3: Solve the following problems graphically by hand.
Carefully label each constraint, the feasible region, the objective function contours, the optimum point (xl, and the estimated function value at optimum (f (x*)).
a. Max f(x1, x2) = 2x1 + x2
g1 (x1, x2): x12 + x22 ≤ 16
g2 (x1, x2): x1 + x2 ≥ 3
b. Minimize f(x1, x2) = 5x1 10x2
subject to 10x1 + 5x2 ≤ 50
5x1 - 5x2 ≥ - 20
x1, x2 ≥ 0
For inclusion in the typed report, you can scan your hand-drawn graph as pdt and add to your report, OR you can recreate the graphs for the solved problems using MATLAB to add Co your report.
Line Search:
Question 4: Solve the following problems using both Golden Section and Newton Raphson methods.
Given x > 0, use Fibonacci sequence to bound and then solve has per above instructions):
Minimize f (x) = -x3 + 3/4 x4
Given x ≥ 0, use Swann's bounding algorithm to bound and then solve (as per above instructions):
Minimize f (X) = x2 + x - 2√x
Work out 3 steps of each algorithm by hand, and create a table with all pertinent information for Golden Section search; refer the table format in the lecture handout (ignore the "uncertainty" column). For Newton Raphson, create a table reporting the x, f' and f'' at each iteration.
Write a MATLAB script to implement the Golden Section method to solve the problems up to a specified termination tolerance. Report the optimum variable and function values. Plot f vs. x, and mark the estimated optimum.
Hessian Matrix (Hf) of a multivariate function, f (x) , where x = [x1, x2,....xn]
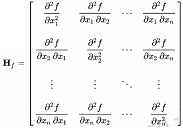
That is, the entry of the ith row and the jth column is
(Hf)i,j = ∂2f/ ∂xi.∂xj
Question: 5 You have a robotic pick and place system to pick up objects (type A, B and C) randomly from a bin. In each pick and place trial, the probability of successfully completing the pick and placing task is independent from previous trials but depends on the type of object. The success rates is 0.8, 0.6 and 0.75 for objects type A, B and C respectively. If there are initially 5 objects of each type in the bin, what is the probability that in 3 trials the robot can successfully pick up 2 objects?
a)Solve Q4 in HW1 using Monte Carlo Simulation with 10,000 trials.
b) in Q4 in HW1 assume that there are initially 50 objects of each type in the bin. using Monte Carlo Simulation with 10,000 trials calculate the probability that in 50 trials at least 30 are successful.
Your program should be written as a function that receives the number of trials as an input and output the probability.