The median- graphical method -progression , Mathematics

Assignment Help:

The median

- it is a statistical value which is usually located at the center of a given set of data that has been organized in the order of size or magnitude as illustrating, consider the set 14, 17, 9, 8, 20, 32, 18, 14.5, 13. While the data is ordered it will be 8, 9, 13, 14, 14.5, 17, 18, 20, 32

The middle number or median is 14.5

-  The significance of the median lies in the fact that it divides the data into two equivalent halves. The number of observations above and below the median is equal.

-   In order to find out the value of the median from grouped data. While data is grouped the median may be determined by utilizing the given methods.


i.  Graphical method by using the cumulative frequency curve or ogive

ii.  The formula

Illustration

Referring to the table which is given below; determine the median by using the methods above

IQ

No of resid

UCB

Cumulative Frequency

0 - 20

6

20

6

20 - 40

18

40

24

40 - 60

32

60

56

60 - 80

48

80

104

80 - 100

27

100

131

100 - 120

13

120

144

120 - 140

2

140

146


                               360_The median- graphical method -Progression.png

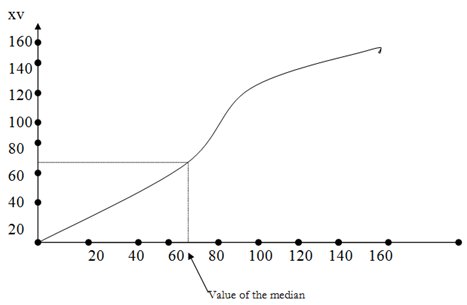
Hence the position of the median is= (n + 1)/2

= (146 + 1)/2

ii. Computation

The formula utilized is

                                              2429_The median- graphical method -Progression 1.png

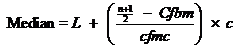
Whereas L = Lower class boundary of the class having the median

            N = No of observations

            Cfo= cfbm = Cumulative frequency of the class before that having the median

            F1 fmc = Frequency of the class having the median


                                         1337_The median- graphical method -Progression 2.png

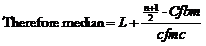
= 60 + ((73.5 - 56)/48) * 20

= 60 + 7.29

= 67.29


Related Discussions:- The median- graphical method -progression

Demonstrate that dijkstra algorithm - digraph, Demonstrate that Dijkstra's ...

Demonstrate that Dijkstra's algorithm does not necessarily work if some of the costs are negative by finding a digraph with negative costs (but no negative cost dicircuits) for whi

Probability, joey asked 30 randomly selected students if they drank milk, j...

joey asked 30 randomly selected students if they drank milk, juice, or bottled water with their lunch. He found that 9 drank milk, 16 drank juice, and 5 drank bottled water. If the

Activity on Node, schedulling problem with variability in task times

schedulling problem with variability in task times

Design a game strategy involves process of learning maths, Doing these sums...

Doing these sums initially in this way helps children see why they carry over numbers to the next column. You may like to devise some related activities now. , EI) Give activ

Identify the children strategies to solve maths problems, Here are four pro...

Here are four problems. Four children solved one problem each, as given below. Identify the strategies the children have used while solving them. a) 8 + 6 = 8 + 2 + 4 = 14 b)

Statistics, the median of a continuous frequency distribution is 21.if each...

the median of a continuous frequency distribution is 21.if each observation is increased by 5. find the new median

Determine the value of the unknown side of a right triangle, Determine the ...

Determine the value of the unknown side of a right triangle: The two legs of a right triangle are 5 ft and 12 ft.  How long is the hypotenuse? Now Let the hypotenuse be c ft.

Equivalence class and equivalence relation, 1. For a function f : Z → Z, le...

1. For a function f : Z → Z, let R be the relation on Z given by xRy iff f(x) = f(y). (a) Prove that R is an equivalence relation on Z. (b) If for every x ? Z, the equivalenc

Write Your Message!

Captcha
Free Assignment Quote

Assured A++ Grade

Get guaranteed satisfaction & time on delivery in every assignment order you paid with us! We ensure premium quality solution document along with free turntin report!

All rights reserved! Copyrights ©2019-2020 ExpertsMind IT Educational Pvt Ltd