Determine an expression for the transfer function, MATLAB Programming

Assignment Help:

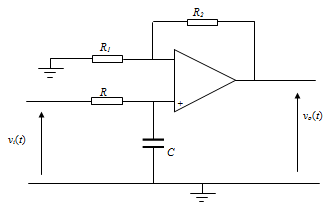
The circuit diagram of an active filter is shown below.

(a) Determine an expression for the transfer function of the filter.

(b) Hence find an expression for the frequency response of the filter.

(c) Calculate the ratio R1/R2 when low-frequency gain of the filter is 40 dB.

(d) Calculate R and C such that the break frequency on the Bode plot occurs at w0 = 500rad/s, (suggest commercially available values).

(e) For the values of the components obtained in parts (c) and (d) simplify the transfer function of the filter.

(f) Hence, using inverse Laplace transform, find h(t), the unit impulse response of the system.

(g) If the input to the filter is vi(t)=10e-100t find an expression for the output of the system.

(h) For the input vi(t)=1/√2 cosθ, obtain an expression for the steady-state sinusoidal response of the filter. 

1176_steady-state.png

Practical work

1.  Invoke MATLAB.

2.  The enclosed m-file is a MATLAB program that simulates the above problem.  In a new m-file type in the entire commands in the m-file

3.  Save the m-file, giving it a suitable file name.

4.  In MATLAB command window execute the program by typing its file name.

5.  If you have made no typing error(s), you should obtain a plot of the Magnitude and the Phase of the Frequency Response of the filter.

6.  Use the Bode plot for the magnitude and phase of the frequency response and measure and calculate the gain and phase for the input signal vi(t) = 1/√2 cos(500t), hence (i.e. using these measured values) write down an expression for the output of the filter.

7.  Verify that your measurements from the plots are in agreement with what you have found theoretically.  Comment with reason(s) if they do not agree.

8.  If the input to the filter is vi(t) =3 sin(2000 t), then what is an estimated expression for the output of the filter?  Write it down and explain how you came up with this answer.


Related Discussions:- Determine an expression for the transfer function

3-A-Day, Savannah says that the least common multiple of 4 and 6 is 24. Is ...

Savannah says that the least common multiple of 4 and 6 is 24. Is she right or what is her mistake?

Find and compute the natural frequencies, An electric overhead traveling cr...

An electric overhead traveling crane, consisting of a girder, trolley, and wire rope, is shown in figure. The girder has a flexural rigidity (EI) of 6x10 12 lb.in 2 and a span (L

EMG, How to make EMG analysis by Matlab?

How to make EMG analysis by Matlab?

Program for add sinusoid with frequency, Job: Add sinusoid with frequency 1...

Job: Add sinusoid with frequency 1000 Hz and amplitude 100 to the one generated in Job 1 (: Create a function using mat lab to generate a sinusoidal signal. The parameters of the s

Find the spectrum of waveform, (a) Find the spectrum of this waveform:  x =...

(a) Find the spectrum of this waveform:  x = [ exp( -[0:1:49]/10), exp(-[50:-1:1]/10)]. Subplot only the magnitude by using the spectrum program from the class notes. (b) Using

Show the output - algorithms, Show the output - algorithms: Where does...

Show the output - algorithms: Where does the output go? The two possibilities are (i) to an external file, or (ii) to a window on the screen. Based on system, one of these wil

Build a single phase model for the simple 3-phase system, Build a single ph...

Build a single phase model for the simple 3-phase system shown in the single line diagram shown below using SimPowerSystems in MATLAB Simulink. Data: Source Voltage

Matrix addition, Write a program in Mathlab for addition of two matrices.

Write a program in Mathlab for addition of two matrices.

Real time color recognition, Hello my name is lalitkumar and I am a student...

Hello my name is lalitkumar and I am a student.I needed help in MATLAB for recognition of colour randomly using webcam realtime for RGB without external trigger.please mail the co

Population pyramid, I want to write a function in matlab which gives me a p...

I want to write a function in matlab which gives me a population pyramid bar chart. could you please help me do this.

Write Your Message!

Captcha
Free Assignment Quote

Assured A++ Grade

Get guaranteed satisfaction & time on delivery in every assignment order you paid with us! We ensure premium quality solution document along with free turntin report!

All rights reserved! Copyrights ©2019-2020 ExpertsMind IT Educational Pvt Ltd