Asset information management system, Electrical Engineering

Assignment Help:

Asset information management system:

GIS has the potential to revolutionize the reform procedure in areas such as consumer indexing, asset and work management, distribution network mapping, enhancing billing and collection efficiency and managing consumer relationships. Thus, GIS is a valuable tool for improved decision-making through efficient MIS. In fact, many utilities are using GIS for preparing an inventory of the existing network, gaining easy access to network details and consumer data, data analysis and network improvement, load growth projections, etc. 

GIS based customer indexing and asset information management system could provide the requisite managerial inputs for decision making. This could form the basic application to which all other business processes would be integrated.

GIS would help utilities in the following ways:

•  Visualization: GIS can visualize the actual network, as it is laid out on ground. It helps provide a snapshot of the locations of substations, lines and cables in relation to their geographical bearings. It also plots the locations of consumers with respect to their feeding networks (starting with the source and ending with the end-user).

•  Convenience: GIS is user friendly and provides ease of data entry. Since the data are digitised, several interactive applications are possible that permit automated mapping, facilities management and network solutions.

•  Flexibility: With GIS, utilities have the flexibility of choosing the other systems to share or exchange data with (i.e., Network Analysis, Inventory, Trouble call analysis); and

•  Better comprehension.

524_Asset information management system.png

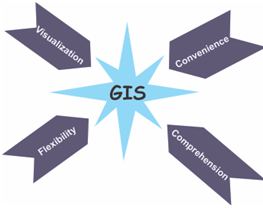
Figure: Advantages of GIS as an Effective IT Support System


Related Discussions:- Asset information management system

What is the basic principle of oscillators, Q. What is the basic principle ...

Q. What is the basic principle of oscillators?  In an oscillating circuit, the amplitude of voltage or current oscillations decays with time owing to the dissipation of energy

Find the net force experienced by a positive charge, Q. Two charges of equa...

Q. Two charges of equal magnitude 5µC but opposite sign are separated by a distance of 10 m. Find the net force experienced by a positive charge q = 2 µC that is placed midway betw

Lead acid accumulators with electrical equipment, Lead Acid Accumulators : ...

Lead Acid Accumulators : These are the most common storage batteries which can deliver a heavy current when short-circuited. There are also many other hazards with these accumulat

Define and explain numerical aperture, Define and explain Numerical apertur...

Define and explain Numerical aperture? Figure shown below shows an incident ray to the fibre, The light bends at two interfaces, one at the air- core interface and the

R-C phase shift oscillator , Sketch the circuit diagram of a 4- ladder netw...

Sketch the circuit diagram of a 4- ladder network R-C phase shift oscillator and explain its principle of operation. Also determine the gain of the basic amplifier necessary for th

Short circuit, what is the time of short circuit ?

what is the time of short circuit ?

Calculate the iron loss, Q. The efficiency of a 400-kVA, single-phase, 60-H...

Q. The efficiency of a 400-kVA, single-phase, 60-Hz transformer is 98.77% when delivering full-load current at 0.8 power factor, and 99.13%with half rated current at unity power fa

What is independent bus request scheme, What is independent bus request sch...

What is independent bus request scheme? Each of the master's needs a pair of request and grant pins which are connected to the controlling logic. The busy line is common for al

Show implementation of synchronous counter using d flip-flop, Q. Consider t...

Q. Consider the synchronous counter shown in Figure of the text. (a) Draw its timing diagram. (b) Show the implementation of the same synchronous counter using D flip-flops.

Gets parameters data display, On running the simulation, a data display wil...

On running the simulation, a data display will automatically open, similar to that shown in figure. The red circle is the source mismatch stability curve. This will give an indicat

Write Your Message!

Captcha
Free Assignment Quote

Assured A++ Grade

Get guaranteed satisfaction & time on delivery in every assignment order you paid with us! We ensure premium quality solution document along with free turntin report!

All rights reserved! Copyrights ©2019-2020 ExpertsMind IT Educational Pvt Ltd