Aggregate demand in the cross model, Macroeconomics

Assignment Help:

Aggregate demand in the cross model

Because C and Im depends positively on Y while G, I and X are exogenous, aggregate demand YD will depend positively on Y: 

YD(Y) = C(Y) + I + G + X - Im(Y)

When Y increases, C and Im increases though since C increases more than Im, aggregate demand would increase when Y increases.  

You may react to the notation YD(Y). Though if you think of Y as the national income (GDP = national income) then YD(Y) basically tells us that aggregate demand depends on income. Aggregate demand is the total quantity of finished services and goods that all sectors (government, consumers, firms and rest of the world) together wish to buy under different conditions. Notation YD(Y) tells us that only endogenous variable which affects aggregate demand is national income. The higher the income, the more we wish to buy. YD, C, Im, S, SH, SG, SR and NT all rely on Y whereas I, G and X are exogenous. We can explain this using the following diagrams. 

1898_Aggregate demand in the cross model.png

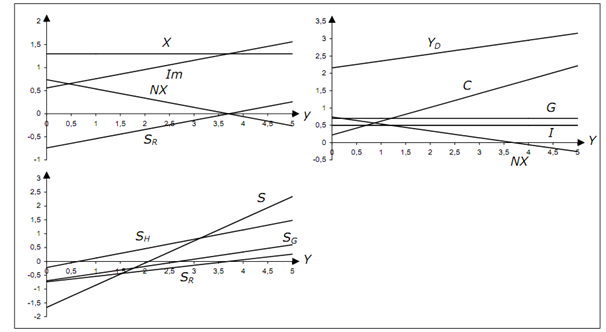
Figure: Aggregate demand and its components

Every diagram has real GDP on the x-axis. 

  • First diagram demonstrates exports (X), imports (Im), net exports (NX) and rest of the world savings (SR). In this figure, X = 1.3 and Im = 0.56 + 0.2Y.
  • Second diagram illustrates private consumption (C), investment (I), government spending (G), net exports (NX) and aggregate demand (YD = C + I + G + NX). Here, C = 0.22 + 0.4Y, I = 0.5, G = 0.7.
  • Third diagram shows private savings (SH), public savings (SG), rest of the world savings (SR) and total savings (S = SH + SG + SR). They are created from NT = 0.26Y.

This figure précises all variables in the cross model and how they rely on Y. Essentially these dependences will be the same in all of the Keynesian models.


Related Discussions:- Aggregate demand in the cross model

Expected profit or loss for the university, The enrollment in a course offe...

The enrollment in a course offered by the College of Business is random and is described by the following probability distribution: there is a 9% chance of 18 students, 22% chance

Two quarters of increasing levels of production, After two quarters of incr...

After two quarters of increasing levels of production, the CEO of Canadian Fabrication & Design was upset to learn that, during this time of expansion, productivity of the newly hi

Starbucks marketing department, If Starbucks's marketing department estimat...

If Starbucks's marketing department estimates the income elasticity of demand for its coffee to be 2.9, how will the prospect of an economic bust (expected to decrease consumers' i

Heckscher-ohlin model, Which of the following statements regarding the heck...

Which of the following statements regarding the heckscher-ohlin model and Ricardian trade theory is TRUE? a. Both the Heckscher-Ohlin and Ricardian models are current, relevant,

Mec, Lucas’ point of view, what are the limitations of the Keynesian model?...

Lucas’ point of view, what are the limitations of the Keynesian model? What improvements does he suggest?

TERMS OF TRADE, HOW INCOME TERMS OF TRADE DIFFER WITH COMMODITY TERMS OF TR...

HOW INCOME TERMS OF TRADE DIFFER WITH COMMODITY TERMS OF TRADE"

GLOBAL LOSSES, SUPPOSE MR.CHANSA DEPOSIT HIS MONEY INTO BANK-B,HOW WOULD TH...

SUPPOSE MR.CHANSA DEPOSIT HIS MONEY INTO BANK-B,HOW WOULD THE T-BALANCE SHEET LOOK LIKE FOR BANK-B

Lloyd''s of London, what characteristic of Lloyd''s of london business orga...

what characteristic of Lloyd''s of london business organization was responsible for the financial losses suffered by the Names who had invested in Lloyd''s?

Classical economic theory, Between 2007 and 2009 the U.S. economy experienc...

Between 2007 and 2009 the U.S. economy experienced a severe recession. In an effort to stimulate the economy, the federal government passed a stimulus package. Explain the federal

Define the term- inflation, Define the term- inflation Inflation betwee...

Define the term- inflation Inflation between two points in time is defined as the percentage increase of price index between these two points in time.

Write Your Message!

Captcha
Free Assignment Quote

Assured A++ Grade

Get guaranteed satisfaction & time on delivery in every assignment order you paid with us! We ensure premium quality solution document along with free turntin report!

All rights reserved! Copyrights ©2019-2020 ExpertsMind IT Educational Pvt Ltd