Reference no: EM1386265
Problem 1: What-if and Goal-seeking analysis
George is planning to set up a new hair salon in a trendy inner city Melbourne suburb. George estimates that his fixed annual costs (which include rent, loan interest, electricity expenses, etc.) will be $150,000. He is planning on employing a total of five hair stylists, who will each work 1,600 hours per year. He plans to charge a fixed price for haircuts ($35 for men, $60 for women), and estimates that 65% of his customers will be women. He is having difficulty determining the pay structure for the hair stylists, and is considering the following three possibilities:
Scenario 1: Fixed hourly rate of $40 per hour.
Scenario 2: Fixed hourly rate of $20 per hour + a commission on each haircut of 20% of the cost of the haircut.
Scenario 3: No fixed hourly rate, but a commission on each haircut of 30% of the cost of the haircut.
George would like to know the following:
- Under each of the above scenarios, what would be the break-even point in the number of haircuts; i.e., how many haircuts must the salon deliver in order to just cover total costs?
- In Scenario 2 (i.e., fixed hourly rate + commission), assuming the salon would deliver a total of 5,000 hairstyles for the year, what would the commission need to be in order for the total costs to be the same as per Scenario 1?
Create an Excel spreadsheet that George can use as a decision support tool to answer his questions. The spreadsheet should be designed such that George would be able to use the spreadsheet without any additional documentation.
Problem 2: Portfolio planning using optimization
Gerry has just obtained a job in portfolio planning at a newly created investment company. His manager has given him the responsibility of investing $10 million, and he must maximise the expected return of the investment over the next year. He has four investment alternatives available to him. The expected return for each of these alternatives, together with the maximum amount he is able to invest in each of these alternatives, is given in the following table.
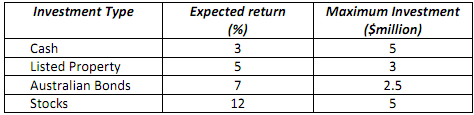
There are some additional constraints on how the funds can be invested:
- a maximum of 35% of the funds may be placed in stocks;
- a minimum of 25% of the funds is to be placed in cash;
- the combined amount in bonds and stocks cannot exceed the combined amount in cash and property;
- all of the available $10 million must be invested; and
- each investment must be in multiples of $10,000.
Part 1: Set this problem up as a linear programming model in Excel, and use Solver to determine how the $10 million should be invested. What is the overall return (in dollars terms)? What is the overall return as a percentage of the $10 million invested?
Part 2: The expected return rates for the investment alternatives given in the table above are only estimates. Assuming that the funds will be invested as per your solution in Part 1, use at least 100 simulations to investigate the distribution in overall return that would be expected under the assumption that each of the returns in the above table is normally distributed about the expected return with a standard deviation of 10% for cash, 10% for listed property, 10% for Australian Bonds, and 50% for Stocks.
Use a chart (e.g., a histogram) to show the distribution of the returns in your simulations. Is the overall return normally distributed? What is its standard deviation? Provide the 95% confidence interval for the mean return.
Problem 3: A Monte Carlo Simulation Problem
Harry owns a bookshop next door to George's hair salon. Inside the bookshop is a small area where customers can purchase a cup of coffee and snacks while they sit down and browse through books. Harry has recently started selling chocolate muffins, which have been very popular with the customers.
Harry purchases the muffins from a wholesaler at $2.00 per muffin, and sells them to his customers at $6.00 per muffin. Sometimes Harry has muffins left at the end of the day. Fortunately, he is still able to sell these leftovers at $0.50 per muffin. However sometimes he has more customers than muffins, and he fears that in such cases he will not only lose out on the profit of $4.00/muffin, but may lose potential book-buying customers to his competitor up the street, who has also started selling snacks and refreshments in his store.
Harry knows that you are doing a course in decision support systems, and has asked you to help him determine the optimal number of muffins to order each day. Fortunately, Harry has kept records over the time he has been selling the muffins, and estimates that the daily demand for muffins can be approximated by a normal distribution with a mean of 75, and a standard deviation of 15.
Use Excel to create a simulation model to assist Harry in determining the optimal number of muffins to order daily. You should produce a chart showing how his expected profit depends on the number of muffins he orders. From this chart estimate the optimal number of muffins to order.
Problem 4: Mining a Bank Marketing dataset
You have just started working at a bank, and your boss has recently become interested in data mining, and particularly the opportunities that it might provide for direct marketing of some new investment products that his bank has created. Your boss knows that you have taken a course in decision support systems that included a component on data mining, and he would like you to provide him with some information on data mining and its use in direct marketing. He has referred you to the following paper, which he recently became aware of, but, given his lack of background knowledge in this area, finds difficult to understand: "Using Data Mining for Bank Direct Marketing: An Application of the CRISP-DM Methodology", by Moro, Laureano and Cortez (2011). He would like you to access the datasets used in this paper, apply a number of data mining algorithms to this data, and to write a report on your investigation and findings.
The datasets:
The datasets used in the paper by Moro et al can be found in the file bank.zip Note that the file bank.zip contains a number of files:
- bank-names.txt, which contains, amongst other information, a description of the fields contained in the dataset;
- bank-full.csv, which is the full dataset, containing 45,212 examples, and
- bank.csv, which is the reduced dataset, containing 4,521 examples (10% of the samples in the full dataset).
For this exercise, you are to use the reduced dataset bank.csv. Note, however, that even though this file contains the extension '.csv', it is not, in fact, a comma-separated file. You will need to do some pre-processing before you will be able to open this in WEKA. It is suggested that you open the file in a text editor that has find-and-replace capabilities, and replace the semicolon characters (i.e., ';') with commas (i.e., ','). You will probably also need to remove the quotation marks.
The experiments:
After pre-processing the dataset appropriately, use the WEKA data mining toolkit to apply each of the following classifiers to it:
- J48 (this is the WEKA version of Quinlan's C4.5)
- Logistic Regression
- Naïve Bayes
Remember that we are mainly interested in the capability of the classifier to correctly predict the class of examples which have not been used in model construction, so you will have to choose your test options carefully.
For this exercise we are interested in evaluating the classifiers in terms of Lift and Receiver Operating Characteristics (ROC). For each of the above classifiers, you are required to provide both the ROC curve and a decile chart showing the Lift. All three ROC curves should be presented on one chart, and, likewise, a single chart should be used for Lift data. The chart showing ROC curves should also show the value of the area under the ROC curve (this is available from the WEKA Classifier Output window).
You will probably find it easiest to produce the ROC and Lift curves using Excel. In order to do this, you will need to export the relevant output from WEKA. You can do this by right-clicking on one of the results in the WEKA Result List, pointing the cursor to 'Visualize threshold curve' and selecting 'yes'. A new window should appear showing an ROC curve for the classifier. Click on the 'Save' button to export the data to an .arff file, which you can then edit before opening in Excel.
The report:
Now that you have your results, you need to write a report for your boss. He is mainly interested in finding out whether the techniques that you have investigated really are able to provide him with information that will be useful to him in his marketing of the new products. But he doesn't want to just be provided with a collection of results -- he would like a clear explanation of your investigation and your findings, and of the important principles behind data mining.
Although your boss completed a university business degree many years ago (which included a few units in statistics), he is not familiar with data mining, so your report will have to explain the important concepts. Note that he doesn't like encyclopaedia-like definitions, so make sure that your explanations are clear, simple, and easy to understand. If you do use technical terms, then you must explain them very clearly. (As an example, the report needs to include the ROC curves and Lift charts that you have constructed, so you will need to explain what these curves and charts show, together with requisite concepts such as true positive rate, etc.).
The following list of points is intended as a guide in creating the report, and thinking about the sort of information your boss should be given. It is not intended to be an exhaustive description of the content that your report should include, and there may be other important topics that you wish to address in your report. Do not just simply answer the questions one after the other. The report will be assessed based on the extent to which it provides a clear, complete, and integrated description of your investigation and your results.
- What is a classifier? Why is this problem a classification problem?
- In what essential way do the classifiers that you have used differ to one another?
- How are classifiers developed? What type of data do they require?
- How can the predictions of a classifier be evaluated?
- What do the ROC curves and Lift charts represent? How can they be interpreted?
- Which classifier would you recommend your boss to use? Why? Is this recommendation based on any specific assumptions?
- How useful are your results?