Reference no: EM131203312
Question 1:
1 Introduction:
Measurements have been made of a cantilever beam's deflection (stored in the file ass2q1in.csv). You must determine what type of loading has been applied and the magnitude of the load. There are four possibilities to test:
1. Point load (with units of force) on the end, Eq. (1) and Fig. 1(a)
2. Moment (with units of force multiplied by length) at the end, Eq. (2) and Fig. 1(b) 3.Uniformly-distributed load (UDL) (with units of force per unit length), Eq. (3) and Fig. 1(c)
4. Uniformly-varying load (UVL) (with units of force per unit length), Eq. (4) and Fig. 1(d).
The formulae for the deflections are:
vP = - Px2/6EI (3L - x) (1)
vM = -Mx2/2EI (2)
vUDL = - wx2/24EI(x2 + 6L - 4Lx)
vUVL = -w0x2/(10L3 - 10L2x + 5Lx2 - x3)
For your assignment, the following values are to be used:
E = 1.412 × 10² GPa
I = 6.0351 × 108 mm4
L = 9.0 m
Requirements
For this assessment item, you must perform hand calculations:
1. Rearrange Eqs. (1)-(4) by hand to obtain a formula for the load (i.e. P , M , w or w0).
2.Take the first, median and last data points and substitute them into the formulae obtained from Requirement 1. Calculate the average value for each of the loads.
3. Using the average values determined in Requirement 2, determine which of Eqs. (1)-(4) is the best curve-fit when considering the first, median and last data points. Verify your result using Excel.
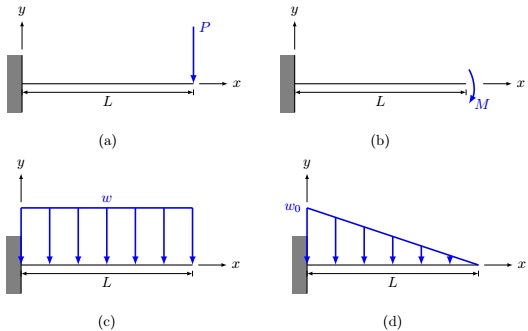
Figure 1: Cantilever beam loadings. The grey box on the left represents the solid wall on which the beam is mounted. (a) Point load with force P ; (b) moment of magnitude M ; (c) UDL with magnitude w; (d) UVL with force per unit length a magnitude of w0 at the wall and magnitude 0 at the free end.
You must also produce MATLAB code which:
4. Performs curve-fits of all the data.
5. Determines what type of loading has been applied based on which curve-fit is the best. 6.Demonstrates that the chosen curve-fit is the best both graphically and numerically.
7. Displays a message in the Command Window stating which type of curve-fit was chosen, stating the parameters of the curve-fit and the result of the numerical test of the curve-fit.
8. Estimates the magnitude of the load for your chosen curve-fit (i.e. one of P , M , w or w0) using the formula obtained in Requirement 1. Reports an estimated error for the load calculation.
9. Compares the results from Requirements 2 and 8 and comments on the outcome.
10. Has appropriate comments throughout.
Question 2
Introduction
One of the challenges with the results of Question 1 is that the curve-fits don't precisely match the forms of Eqs. (1)-(4) (they don't satisfy the boundary conditions of zero deflection and zero slope at the fixed support). In this question, you will perform curve-fits which do precisely match the forms of Eqs. (1)-(4). To achieve this, you need to solve appropriate simultaneous equations for the polynomial coefficients, where the data values are known. For instance, suppose you have the data in Table 1. You might recognise that this satisfies the form
y = f (x) = a1x2 + a3 + ε, (5)
where ai, i ∈ [1, 3] are the polynomial coefficients, a2 = 0 and ε is an error. The unknown coefficients are to take values so that when each (x, y) pair is substituted into Eq. (5), the value of ε is minimised. To enforce the constraint a2 = 0, when solving the simultaneous equations to determine ai, you don't include a2 in the vector of unknown ai.
Table 1: Sample (xi, yi) data
|
i
|
x
|
y
|
|
1
|
1
|
-6
|
|
2
|
3
|
10
|
|
3
|
4
|
24
|
|
4
|
6
|
64
|
|
5
|
8
|
120
|
|
6
|
9
|
154
|
Requirements
For this assessment item, you must perform hand calculations:
1. Using the first two rows of Table 1, solve Eq. (5) for a1 and a3 using substitution or elimination.
2. Repeat Requirement 1, but express the set of equations in the form
Aa = y (6)
a = [a1]
[a3]
y = [y1]
[y2]
y = Then invert A and determine a1 and a3.
3. Perform the same calculations as in Requirement 2, but use the first and last data values from ass2q1in.csv and estimate the polynomial coefficients for Eq. (1).
You must also produce MATLAB code which analyses the data in ass2q1in.csv:
4. Performs a curve-fit of Eq. (1) using all the data. Solve for a complete cubic polynomial (include all polynomial coefficients) using the method of Requirement 2 to verify your method against polyfit.
5. Performs curve-fits of all the data using polynomials that have the same terms as Eqs. (1)- (4).
6. Determines what type of loading has been applied based on which curve-fit is the best.
7. Demonstrates that the chosen curve-fit is the best both graphically and numerically.
8. Displays a message in the Command Window stating which type of curve-fit was chosen, stating the parameters of the curve-fit and the result of the numerical test of the curve-fit.
9. Discusses whether the chosen curve-fit from Question 1 is the same as from Question 2 and comments on any reasons.
10. Has appropriate comments throughout.
Question 3:
Introduction
The chosen switch to be used in an inverter is an IGBT (Insulated Gate Bipolar junction Transistor), the voltage-controlled drive side of a MOSFET with the power side of a power transistor. One design issue for these devices is to ensure that they do not overheat and therefore fail. Your task is to check whether the SEMIKRON SKM75GB12T4 is an appropriate choice for the application. The specifications for this unit are available from the StudyDesk. This question relies heavily on Figs. 1 and 3 from those specifications.
The gate drive voltage (VGE) is the input voltage to the switch and for a particular rated current (IC ) and temperature (Ti) there is a specific voltage drop across the switch (VCE) which occurs. The greater the value of VCE, the greater the energy losses (Eon + Eoff) and therefore the more likely it is that the switch will overheat. Your task is to determine whether the energy losses are below the critical value Ecrit for your particular application. The switch will overheat if the energy losses reach the critical value.
For your assignment, the following values are to be used:
IC = 7:1009 x 5 + 25 A
VGE = 9:8123 / 3 + 11 V
Ti = 150�
Ecrit = 7:7219 x 2 mJ
VCC = 600 V;
For this assessment item, you must perform hand calculations based on Figs. 1 and 3 from the SEMIKRON spec. sheet:
1. For the value of Ti and VGE = 15 V, determine the values of VCE for IC = 25 A, 50 A and 75 A.
2. Using the values from Requirement 1, use linear interpolation to determine the value of VCE for your value of IC .
3. Repeat Requirement 1 for VGE = 11 V. 4.Repeat Requirement 2 for VGE = 11 V.
5. Using your results from Requirements 2 and 4, estimate the value of VCE for your value of VGE.
6. For your value of IC , determine the values of Eon and Eoff for VGE = 15 V.
You must also produce MATLAB code which uses the data from Figs. 1 and 3 in the SEMIKRON spec. sheet:
7. Using the values from Requirement 1, use linear interpolation to determine the value of VCE for your value of IC (obtain the same answer as Requirement 2).
8. Repeat Requirements 4 and 5. Verify your result against that from Requirement 5.
9. Calculate the result from Requirement 8 directly from the data in Requirements 1 and 3 (i.e. perform one linear interpolation operation to determine the answer). Compare your result with that from Requirement 8 and discuss why they are similar or different.
10. Estimate the error in your calculation of Requirement 7. As part of this error estimation, use the formula:
d2VCE/dI2C = VCE(IC = 25 A) - 2VCE(IC = 50 A) + VCE(IC = 75 A)/(25 A)2. (10)
Discuss the size of the error and how accurate you consider the answer from Requirement 8 to be.
11. The values from Requirement 6 are proportional to VCE. Determine the values of Eon and Eoff for your value of VCE from Requirement 8. Thereby test whether this switch will overheat for the given operating conditions.
12. Has appropriate comments throughout.
Question 4
Introduction
At the start of the film "Rosencrantz and Guildenstern are Dead", unbiased coins are tossed. The first 157 tosses are all heads, before the 158th toss yields a tail.
In another test, an unbiased coin is tossed 10 times and the total number of tails is counted. This test is repeated 20 times (so the coin is tossed a total of 200 times), with the results recorded in Table 2:
Table 2: Total number of tails k for n = 10 coin tosses. Each i is an independent test.
| i |
1 |
2 |
3 |
4 |
5 |
6 |
7 |
8 |
9 |
10 |
11 |
12 |
13 |
14 |
15 |
16 |
17 |
18 |
19 |
20 |
| k |
8 |
5 |
5 |
7 |
4 |
4 |
7 |
4 |
7 |
5 |
5 |
5 |
6 |
6 |
2 |
1 |
6 |
3 |
1 |
4 |
The binomial distribution describes the probability for a binary system [where there are two possible outcomes for a realisation (e.g. an individual coin toss), a set of realisations forms a test (in Table 2 there are 10 realisations in each test) and each realisation is independent of each other]. A set of tests forms the sample (in Table 2 there are 20 tests in the sample). There are two parameters: n, which is the total number of realisations in the test; and p, which is the probability of the target outcome.
A limitation of the binomial distribution is that it only contains information on the total number of instances: it does not provide information on the actual sequence of values. To obtain that additional information, you actually need to conduct the random test (the total of which will obey the binomial distribution).
To obtain consistent results from your random number generation, you should initialise the seed to a fixed value using rng(seed). For your assignment, the value is:
seed = 7.0925
Requirements
For this assessment item, you must perform hand calculations on the data in Table 2: 1.Calculate the sample mean and standard deviation.
2. Calculates the population mean E(k) = np and population variance E(kt2) = np(1 - p).
3. Plot the sample pdf. You can produce the plot in MATLAB, but you must perform the calculations by hand.
You must also perform hand calculations:
4. Hypothesise a random sequence by writing a sequence of 10 realisations of a coin toss (write "H" for "Heads" or "T" for "Tails"), making the sequence obey what you consider to be a completely random sequence. This forms a single test of 10 realisations. At the conclusion of the test, write the total number of tails and also the longest sequence of repeating values (e.g. in the sequence "HTHHTT" the result is 2 because the 3rd and 4th values are both H; it is also 2 because the 5th and 6th values are both T).
5. Actually perform a coin toss 10 times and record the same information as Requirement 4 (conduct a test).
You must also produce MATLAB code which analyses Table 2:
6. Calculates the sample mean and standard deviation for the data in Table 2.
7. Plots the sample pdf of Table 2, with the calculations performed in MATLAB. Plots the population pdf on the same axes.
8. Verifies that all the MATLAB calculations match the hand calculations.
9. Compares the sample mean and standard deviation to the population mean and population variance (note that it is not easily possible in MATLAB to calculate confidence intervals for sample statistics of a binomial distribution). Also compares the sample pdf to the population pdf.
10. Randomly produces a sequence of 10 coin tosses and records the same information as Requirement 4 (conduct a test).
11. Compares all the outcomes from Requirements 4, 5 and 10.
12. Repeats the test from Requirement 10 so that a total of 20 tests are conducted and compares the results with Requirements 6 and 7 (compile a sample of 20 tests).
13. Estimate how big the sample size needs to be in order for the sample pdf to have non-zero probability everywhere the population pdf is non-zero. Report the value to the Command Window. Hint: If the smallest value of the population pdf had an absolute frequency of 1, how many samples would be required?
14. Run additional tests to the 20 that you have performed so that you have conducted the number of tests estimated in Requirement
13. Check to see if every possible value has been sampled.
You must also produce MATLAB code which analyses the longest sequence data: 15.Calculates the probability of 1 realisation being a tail for a test containing 158 realisations.
Calculates the probability that the first 157 tests are all heads and the last test is a tail.
Reports the results to the Command Window.
16. Plots the sample pdf for the longest sequence (as obtained from Requirement 14 if you have completed that, or Requirement 12). Determine which is the most appropriate discrete distribution for this data (discrete distributions only have probabilities for integer values; continuous distributions have probabilities for any number between integers). Determine the appropriate parametric value(s) for your chosen distribution (hint: since a value of 0 is impossible and 1 is "inconceivable", perform this calculation by subtracting 2 from the data and ignoring any instances of 1 in the data). Check whether the sample statistics are consistent with the distribution's parameter(s). Report the parameters and the test results to the Command Window.
17. Estimate the maximum longest sequence of repeated values for a test containing: (a)100 realisations
(b)1000 realisations
(c)104 realisations
(d)105 realisations
Set seed = 1 before running these tests. Report the results to the Command Window. Hint: Run 1000 tests3 for each number of realisations. Change the seed if the longest sequence doesn't monotonically increase with number of realisations.
18. Based on your results from Requirement 17, estimate and report how many realisations would be required in a test to make 157 repeated values possible (i.e. at least 0.1% chance).
19. Has appropriate comments throughout.
Question 5:
You are to write a brief report (about 100 words, excluding any code), which includes:
1.A description of an instance during the writing of your code for this assignment where there was a problem (e.g. a bug, an error, an unexpected result) or the most challenging aspect to overcome.
2. What steps you took to overcome the problem or challenge (including any code you wrote to test the problem/challenge).
3. The code before you resolved the problem or challenge, highlighting the line(s) of code where the problem or challenge occurred.
4. The code after you resolved the problem/overcame the challenge.
5. Code from the MATLAB editor is to be copied into Word; screenshots should be taken of the Command window.
Attachment:- Data.rar