AILURES AND BATHTUB CURVE
The life of a component system can be grouped into three different phases typical curve depicting these three is called the bathtub curve due to its shape. This is a curve with lifetime on X - axis is and failure rate (or hazard rate) on Y - axis. There are three distinct regions of the curve; each representing a different phase is the unit's lifecycle and failures due to distinct causes.
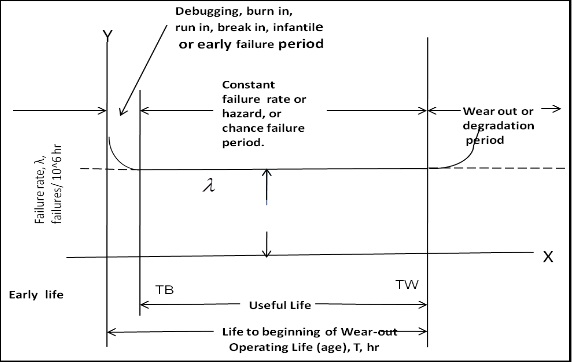
INFANT MORTALITY PERIOD
Initially there are a large number of failures, called initial failures or infant mortality. These failures are primarily due to manufacturing defects, such as weak parts, poor soldering, bad assembly, poor fits, etc. Defective units are detected during the initial failure period, which is characterized by decreasing failure rate. Many manufacturers provide a "debugging" of "burn-in" period for their product, prior to delivery, which helps to eliminate a high portion of the initial failures and assist in establishing a high level of operational reliability.
USEFUL LIFE PERIOD
After initial failures, for a long period of time of operation, fewer failures are reported but it is difficult to determine their cause. They occur primarily due to changes in the working stresses or environment conditions. It is difficult to predict the amplitude of stress variations and their time of occurrence; thus, the failures during this period of normal operation are classified as random failures. This period of normal operation is characterized by a constant failure rate (constant number of failures per unit time).
WEAR OUT PERIOD
As time passes, the units begin to deteriorate due to ageing. A gradual change in the performance of the unit is the result. When the performance goes beyond the permissible limit, the unit fails. This region is called wear-out region. The changes are reversible physical-chemical in nature and the prediction of wear-out failures is very difficult. In this period, the failure rate increases.
Wear-out failures as shown in Fig (2.1) is primarily due to deterioration of the design strength of the device as a consequence of operation and exposure to environment fluctuations. Deterioration results from a number of common chemical and physical phenomena:
- Insulation breakdown or leakage
- Ionic migration of metal in vacuum or on surface
- Frictional wear or fatigue
- Shrinkage and cracking in plastic
Optimizing reliability involves taking into consideration each of the three phases of life periods. Early failure must be eliminated by systematic procedure of controlled screening and burn-in tests. Many manufacturers producing high- reliability components subject their products to an initial burn-in period of "t" hours to eliminate the products having initial manufacturing defects. The period T B to TW constitutes the useful lifetime. Stress related failure must be minimized by
providing adequate design margin. Wear out must be eliminated by timely preventive replacement of short-life component parts. After TW hours of operation, the item is to be replaced by another pre-tested item. Thus all major factors which influence (degrades) a system's operational reliability must be addressed during design to optimize and control system reliability.
Study and design of reliable systems essentially centres on increasing the Reliability; by prolonging the duration a unit remains in the time window between TB and TW; or by increasing the value of TW.
During the useful life period, reliability is described by means of the single parameter exponential distribution:
R(t)=e -λt Where R(t) is the probability that the item will operate without failure
for the time period t (hours), under stated operating conditions; lamda(l) is the item failure rate (failure per hour or fits), and is a constant for any given set of stress, temperature and quality. It is determined for parts and components from large-scale data collection and/ or test programs.
The reciprocal of failure rate is defined as the Mean Time between Failures
MTBF = 1/λ .................................................................................................. (2.1)
MTBF is a figure of merit by which one hardware can be compared to another. It is a measure of the average failure rate (l) during the useful life period.
FAILURE DATA
In general, the type of data required for reliability evaluation is in the form of statistical distributions. These data are time to failure and time to repair after each failure. Data can be collected by two methods:
(1) Field experience
(2) Sample testing
Data are generally collected by sampling techniques, fitted to the most appropriate statistical distributions. Typical data may contain times when elements of the system are installed, put on-line, changed, modified, replaced, or repaired and the man-effort needed for these processes.