Tests in investments, Financial Management

Assignment Help:

Tests in Investments

There are many rules that specify how the past data of share prices can be used to obtain a clue regarding the future prices of shares. Such rules would be valuable to an investor because they could be used to determine which share prices are likely to rise. Hence the investor could buy such share and sell them in future at a higher price thereby earning a profit.

Statistical tests have been applied to examine whether such rules can deliver what they promise. Can investors using these rules earn higher profits than investors not using these rules? Do these rules really provide clues about the future prices of shares? Are short-term share price fluctuations not random in nature? Below are the results of two tests applied to past data of share prices to ascertain whether such data has any information relevant to future share price estimates.

Serial Correlation Tests

We have studied correlation applied to pairs of observations. For example, we can find out the correlation of one share price with another share's price, or the correlation of one company's share price with the company's profits.

In auto-correlation we ascertain the correlation of current observations in a set with past observations of the same set. As applied to investments, serial correlation has been used to find the correlation coefficient between current changes in a share's price and past changes in the same share's price. It was found that the correlation coefficient was very near to zero. If current share price changes are uncorrelated with past share price changes, how can the rules based on a study of past share prices have any predictive value?

Runs Tests

Correlation coefficients are unduly influenced by extreme observations. It was argued that a few unrepresentative extreme observations may have distorted the results of the above Serial Correlation Tests. So Runs Tests were devised. Here, only the directions of share price changes were considered. As the magnitudes of price changes were ignored, the excessive influence of extreme observations was removed.

In a typical Runs Test the changes in share prices may be classified as '+' meaning an increase and '-' meaning a decrease. A run is said to last as long as the price changes do not change direction. For example, given the following daily price changes of a share, we can identify three runs.

1249_runs test.png

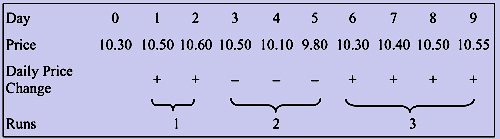
So Runs Tests also appear to support the conclusion that share price changes are random.Runs Tests reveal that the number of runs are nearly equal to the runs that would be expected if share price changes were random.


Related Discussions:- Tests in investments

On-the-run treasury issues, On-the-run treasury issues are the most r...

On-the-run treasury issues are the most recently auctioned issues of a given maturity. They include Treasury bills of 3-month, 6-month and 1-year maturity;  treas

risk/return profile of the convertible security, Let us consider thr...

Let us consider three scenarios of changes in stock prices and look into the risk return profile of the convertible security. Let us assume that the stock prices

Explain the meaning of buy-ins, Explain the meaning of Buy-ins This  is...

Explain the meaning of Buy-ins This  is  when  third  party  management  team  make  a  takeover  bid  and  then  run  business themselves. Finance sources are same as to buy-o

Types of mutual funds, Types of Mutual Funds The objectives of a Mutual...

Types of Mutual Funds The objectives of a Mutual Fund are as follows: To provide an opportunity for lower income groups to acquire property without much difficulty in the

Evaluate the total expected present value of benefits, Question: Susan ...

Question: Susan started her current job at age 30, with the normal retirement age at 60. The remuneration package of her employment includes the following benefits on top of he

Seasonal variation in time series analysis, Seasonal Variation Under th...

Seasonal Variation Under this variation, we observe that the variable under consideration shows a similar pattern during certain months of the successive years. An example of s

Prices and yields, Prices and Yields The face value of the government s...

Prices and Yields The face value of the government security is Rs.100 or Rs.1,000. Earlier, that is, before 1950s the government bonds were issued at a discount. There was no f

Define the operating leverage effect, What is the operating leverage effect...

What is the operating leverage effect and what causes it?  What are the potential benefits and negative consequences of high operating leverage? The phrase operating leverage e

What do you meant by common stocks in the financial term, What do you meant...

What do you meant by common stocks in the financial term? Common Stocks: Common stocks illustrate ownership interests into the firm. Common stockholders obtain dividends (wh

Bond ., The salem company bond currently sells for $955 has a 12% coupon i...

The salem company bond currently sells for $955 has a 12% coupon interest rate and $ 1000 par value pays interest annually an

Write Your Message!

Captcha
Free Assignment Quote

Assured A++ Grade

Get guaranteed satisfaction & time on delivery in every assignment order you paid with us! We ensure premium quality solution document along with free turntin report!

All rights reserved! Copyrights ©2019-2020 ExpertsMind IT Educational Pvt Ltd