Standard Hypothesis Tests
In principal, we can test the significance of any statistic related to any type of probability distribution. Conversely we will be interested in a few standard cases. The sample statistics mean, proportion and variance, are concerned the normal, F, t, and chi-squared distributions
Hence
1. Normal test
Test a sample mean (x¯) against a population mean (µ) whereas samples size n > 30 and population variance σ2 is identified and sample proportion, P whereas sample size np >5 and nq >5 because in this case the normal distribution can be utilized to approximate the binomial distribution
2. t test
Tests a sample mean (x¯) against a population mean and especially where the population variance is un-known and also n < 30.
3. Variance ratio test or f test
This is used to compare population variances and it is used along with samples of any size drawn from normal populations.
4. Chi squared test
This can be used to test the association among attributes or the goodness of fit of an observed frequency distribution to a standard distribution
Illustration 1
A specific NGO carried out a survey in a specific community in order to establish the average at which the girls are married. The results of the survey specified that the marriage age for the girls is 19 years
In order to establish the validity of the mean marital age, a sample of 50 women was interviewed and the average age specified that they got married at the age of 16 years. Conversely the different ages at which they were married differed along with the standard deviation of 2.1years
The sample data specified that the marital age is less 19 years. Is this conclusion true or not true?
Required
Conduct a statistical test to either support the above conclusion drawn from the sample statistics that is the marriage age is less than 19 years, use a level of significance of 5 percent
Solution
1. Null hypothesis
H0: μ (mean marital age) = 19 years
Alternative hypothesis H1: μ (mean marital age) < 19 years
2. The level of significance is 5 percent
3. The test statistics is the sample mean age, x¯ = 16 years
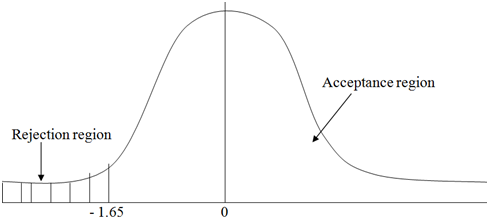
4. The critical value of the one tailed test as one tailed as the alternative hypothesis is an inequality at 5 percent level of significance is -1.65
1. The standardizes value of the sample mean is
Z = (x¯ - μ)/ Sx¯
Whereas Sx¯ = s/√n
Whereas, x¯ = Sample mean
µ = Population mean
S = sample standard deviation
n = sample size
z = standard value as per computation
The standard value Z must fall in the acceptance region for us to accept the null hypothesis. Hence it must be > - 1.65 otherwise we accept the alternative hypothesis.
Z = (16-19)/(2.1/√50) = - 10.1
2. As -10.1 < -1.65, we reject the null hypothesis but accept the alternative hypothesis at 5 percent level of significance that is the marriage age in this community is significantly lower than 19 years