Find out the mean wait in line - probability, Mathematics

Assignment Help:

Example of Probability

Illustration:  It has been determined that the probability density function for the wait in line at a counter is specified by,

691_Find out the mean wait in line - Probability 1.png

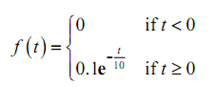
In which t is the number of minutes spent waiting in line. Solve each of the following questions concerning to this probability density function.

(a) Prove that this is in fact a probability density function.

(b) Find out the probability that a person will wait in line for at least 6 minutes.

(c) Find out the mean wait in line.

Solution

(a) Prove that this is in fact a probability density function.  

This function is evidently positive or zero and so there is not much to do here other than calculate the integral.

2027_Find out the mean wait in line - Probability 2.png

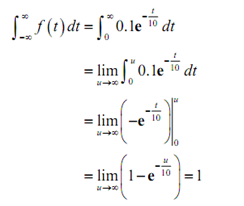
Thus it is a probability density function.  

(b) Find out the probability that a person will wait in line for at least 6 minutes. The probability that we're searching for here is P (x > 6).

2430_Find out the mean wait in line - Probability 3.png

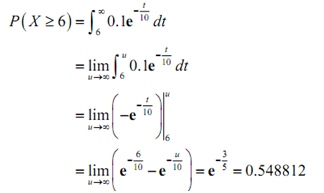
Thus the probability that a person will wait in line for much more than 6 minutes is 54.8811%.

(c) Find out the mean wait in line. 

 Here is the mean wait time.

1043_Find out the mean wait in line - Probability 4.png

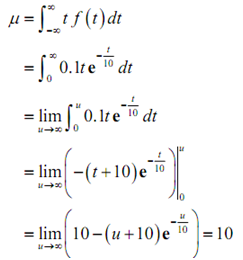
Thus, it looks like the average wait time is 10 minutes.


Related Discussions:- Find out the mean wait in line - probability

MATLAB, Program of "surface of revolution" in MATLAB

Program of "surface of revolution" in MATLAB

Multiples, The sum of the smallest and largest multiples of 8 up to 60 is?

The sum of the smallest and largest multiples of 8 up to 60 is?

Minimum and maximum values, Minimum and Maximum Values : Several applicati...

Minimum and Maximum Values : Several applications in this chapter will revolve around minimum & maximum values of a function.  Whereas we can all visualize the minimum & maximum v

Solution Of Rectilinear Figures, Find the number of square feet of pavement...

Find the number of square feet of pavement required for the shaded portion of the streets shown in the figure, all the streets being 50 feet wide.

Proof of the properties of vector arithmetic, Proof of the Properties of ve...

Proof of the Properties of vector arithmetic Proof of a(v → + w → ) = av → + aw → We will begin with the two vectors, v → = (v 1 , v 2 ,..., v n )and w? = w

Determine how maximum revenue with transportation model, The government is...

The government is auctioning off oil leases at two sites. At each site, 100,000 acres of land are to be auctioned. Cliff Ewing, Blake Barnes and Alexis Pickens are bidding for the

Scatter graphs, Scatter Graphs - A scatter graph is a graph that compr...

Scatter Graphs - A scatter graph is a graph that comprises of points which have been plotted but are not joined through line segments - The pattern of the points will defin

Write Your Message!

Captcha
Free Assignment Quote

Assured A++ Grade

Get guaranteed satisfaction & time on delivery in every assignment order you paid with us! We ensure premium quality solution document along with free turntin report!

All rights reserved! Copyrights ©2019-2020 ExpertsMind IT Educational Pvt Ltd