Sketch the graph parabolas.
f (x ) = 2 ( x + 3)2 - 8
Solution
In all of these we will just go through the procedure given above to determine the required points and the graph.
f (x ) = 2 ( x + 3)2 - 8
First we have to determine the vertex. However we will have to be careful with the signs. Comparing our equation to the form above we illustrates that we should have h = -3 and k= -8 as that is the only way to obtain the correct signs in our function. Thus, the vertex of this parabola is,
( -3, -8)
Now let's determine the y-intercept. it is nothing more than a rapid function evaluation.
f (0) = 2 +(0 + 3)2 - 8 = 2 (9) - 8 = 10 y - intercept : (0,10)
Next we have to determine the x-intercepts. It means we'll have to solve an equation. Though, before we do that we can in fact tell whether or not we'll have any before we even begin to solve the equation.
In this case we have a = 2 that is positive and hence we know that the parabola opens up. Also the vertex is point below the x-axis. Hence, we know that the parabola will contain at least a few points below the x-axis & it will open up. Thus, since once a parabola begin to open up it will eventually continue to open up we will ought to cross the x-axis. In other terms, there are x- intercepts for this parabola.
To determine them we have to solve out the following equation.
0 =2 ( x + 3)2 - 8
We solve out equations such as this back while we were solving quadratic equations so expectantly you recall how to do them.
2 ( x + 3)2 = 8
( x + 3)2 = 4
x + 3 = ±√4 =±2
x = -3 ± 2 ⇒ x = -1, x = -5
The two x-intercepts are then, (-5,0) & ( -1,0)
Now, at this instance we've got points on either side of the vertex thus we are officially done with determining the points. Though, let's talk a little bit about how to determine a second point by using the y- intercept and the axis of symmetry as we will have to do that eventually.
First, consider that the y-intercept contain an x coordinate of 0 whereas the vertex has an x coordinate of - 3. It means that the y-intercept is distance of 3 to the right of the axis of symmetry as that will move straight up through the vertex.
Now, the left part of the graph is a mirror image of the right part of the graph. hence, since there is a point at also be a point at y = 10 which is a distance of 3 to the right of the axis of symmetry there have to y = 10 that is a distance of 3 to the left of the axis of symmetry.
Thus, as the x coordinate of the vertex is -3 & this new point is distance of 3 to the left its x coordinate have to be -6. The coordinates of this new point are then ( -6,10) . We can check out this by evaluating the function at this.
x = -6 . If we are right we must get a value of 10.
Let's verify
f ( -6) = 2 ( -6 + 3)2 - 8 = 2 ( -3)2 - 8 = 2 (9) - 8 = 10
So, we were right. Note that usually we don't bother with the verification of this point. It's time to sketch the graph of the parabola. Following it is.
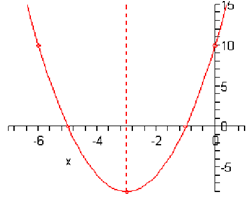
Note that we involved the axis of symmetry in this graph and normally we won't. It was only included here as we were discussing it earlier.