The standard EOQ analysis is depends on the assumption which the price per unit keeps constant irrespective of the size of the order. While quantity discounts are obtainable, that is often the case; the price per unit is affected through the order quantity. That violates the applicability of the EOQ formula. Although, the EOQ framework can still be employed as a starting point for analyzing the problem. To find out the optimal order size while quantity discounts are available the subsequent procedure may be used:
1) Find out the order quantity using the standard EOQ formula by assuming no quantity discount, name as Q*.
2) If Q* facilitates the firm to find quantity discount so it represents the optimal order size.
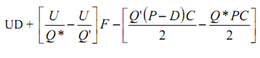
3) If Q* is less than the minimum order size needed for quantity discount (name as Q′) compute the change in profit as a effect of increasing the order quantity from Q* to Q' given as:
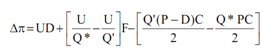
Here
Δπ = change in profit.
U = annual usages/demand
D = discount per unit when quantity discount is available
Q* = economic order quantity assuming no quantity discount
Q′ = minimum order size required for quantity discount
F = fixed cost of placing an order
P = unit purchase price without discount
C = inventory carrying cost expressed as a percentage.
Well at the right-hand side of the equation, the initial term presents savings in price, the next term shows savings in ordering cost and the third term shows the raise in carrying cost.
4) If the change in profit is positive, Q′ shows the optimal order quantity. Whether the change in profit is negative, Q* shows the optimal order quantity.
To demonstrate the above process, see the subsequent data pertaining to Quantum Ltd.
U = annual usage=10,000 units
F = foxed cost per order =Rs. 150
P = purchase price per unit =Rs. 20
C = carrying cost=25% of inventory value
Q′ = minimum order size required for quantity discount=1,000 units
D = discount per unit =Re.1.
The EOQ by assuming no quantity discount:
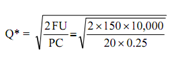
= 75 units
As Q* is less than Q′ (1,000), the change in profit as a effect of raising the order quantity from Q* to Q′ is as:
= 10,000 ×1 + [ (10,000/775) - (10,000/1,000) ] 150 - [((1,000(20 -1) 0.25)/2) - ((775 ×20 ×0.25)/2)]
= 10,000 + 435 - (2,375 - 1,938)
= Rs. 9,998.
As the change in profit is positive, Q′=1,000 shows the optimal order quantity. This must be noted that the above procedure is depends on the principle of marginal analysis. This involves comparing incremental benefits along with incremental costs in moving from one level of inventory to the other. This principle may be used to as a given order quantity along with the present order quantity and more generally for comparing any set of alternatives.