Probability distribution for continuous random variables, Mathematics

Assignment Help:

Probability Distribution for Continuous Random Variables

In a continuous distribution, the variable can take any value within a specified range, e.g. 2.21 or 1.64 compared to the specific values taken by a discrete variable e.g 1 or 3. The probability is represented by the area under the probability density curve between the given values.

The uniform distribution, the normal probability distribution and the exponential distribution are examples of a continuous distribution

-           The normal distribution is a probability distribution which is used to determine probabilities of continuous variables

Examples of continuous variables are

  • Times
  • Capacity Heights
  • Weights
  • Distances
  • e.t.c

- Generally continuous variables are those that can be measured by utilizing the suitable units of measurement.

- specified are the properties of the general distribution

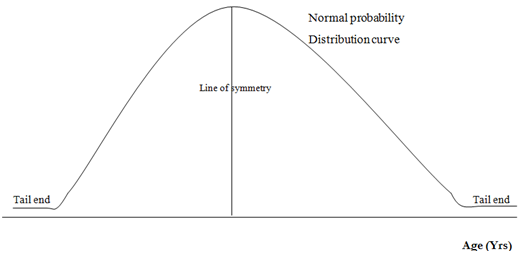
1. The sum of area under the curve is = 1 which is equivalent to the maximum value of probability
701_Probability Distribution for Continuous Random Variables.png

2. The line of symmetry divides curve into two equal halves

3. The two ends of the general distribution curve continuously approach the horizontal axis however they never cross it

4. The values of the mean, mode and median all each are equal

NB: The above distribution curve is referred to as general probability distribution curve since if a frequency distribution curve is plotted from measurements of a specified sample drawn from a general population then a graph similar to the normal curve must be acquired.

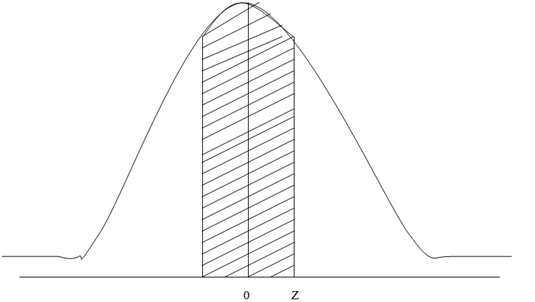
- It should be noted that 68 percent of any population lies in one standard deviation, ±1σ

- 95 percent lies in two standard deviations ±2σ

- 99 percent lies in three standard deviations ±3σ

Whereas σ = standard deviation
182_Probability Distribution for Continuous Random Variables 2.png


Related Discussions:- Probability distribution for continuous random variables

expected value, Describe the distribution of sample means shapefor samples...

Describe the distribution of sample means shapefor samples of n=36 selected from a population with a mean of μ=100 and a standard deviation of o=12.  , expected value, and standard

Mathematics is all around us-mathematics- in our lives, Mathematics Is All ...

Mathematics Is All Around Us :  What is the first thing you do when you get up? Make yourself a nice cup of tea or coffee? If so, then you're using mathematics! Do you agree? Cons

Maths, whats 100 + 90 - 6

whats 100 + 90 - 6

Marketing research, Discuss the role research would play during your decisi...

Discuss the role research would play during your decision making

Find x if one ball is drawn at random from the box, A box contains 12 balls...

A box contains 12 balls out of which x are black .if one ball is drawn at random from the box  what is the probability that it will be a black ball ? If 6 more black balls are   pu

Trigonometry, show that, sin 90 degree = 2 cos 45 degree sin 45 degree

show that, sin 90 degree = 2 cos 45 degree sin 45 degree

Probablity, probability as that of flipping a coin eight times and getting ...

probability as that of flipping a coin eight times and getting all the times the same side of the coin.)

Determine rational exponents, Evaluate following. (a) 625 3/4 Solut...

Evaluate following. (a) 625 3/4 Solution  (a) 625 3/4 Again, let's employ both forms to calculate this one.             625 3/4   =( 625 1/4 ) 3 =(5) 3   = 12

Write Your Message!

Captcha
Free Assignment Quote

Assured A++ Grade

Get guaranteed satisfaction & time on delivery in every assignment order you paid with us! We ensure premium quality solution document along with free turntin report!

All rights reserved! Copyrights ©2019-2020 ExpertsMind IT Educational Pvt Ltd