Patch function - graphics objects, MATLAB in Engineering

Assignment Help:

Patch function - graphics objects:

The patch function is used to generate a patch graphics object, which is made from 2-dimensional polygons. The patch is defined by its vertices and faces. For illustration, consider a patch which has four vertices in 3-dimensional space, given by the coordinates:

(0, 0, 0)

(1, 0, 0)

(0, 1, 0)

(0.5, 0.5, 1)


Just to visualize these points first, the plot3 function is used, as shown in figure:

>> x = [0 1 0 0.5];

>> y = [0 0 1 0.5];

>> z = [0 0 0 1];

>> plot3(x,y,z,'ko')

837_Patch function.png

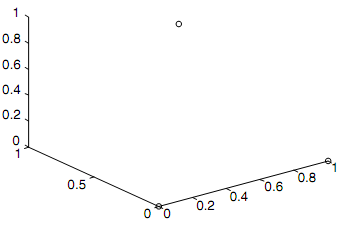
Rotating the figure shows all four points, as shown in figure.

2127_Patch function1.png

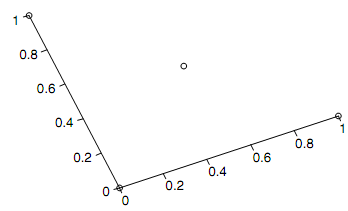
Generating and showing these points is not essential to generate a patch object; this was just complete to visualize at first the vertices . A patch object is defined by both the vertices and the faces of the polygon which connect these vertices. The one way of calling this function is patch(fv),here fv is a structure variable with fields known as vertices and faces.

polyhedron.vertices = [.  .  .

0 0 0

1 0 0

0 1 0

0.5 0.5 1];

polyhedron.faces = [.  .  .

1 2 3

1 2 4

1 3 4

2 3 4];

pobj = patch(polyhedron, .  .  .

'FaceColor',[0.8, 0.8, 0.8],.  .  .

'EdgeColor','black');


Related Discussions:- Patch function - graphics objects

Illustration of anonymous functions, Illustration of anonymous functions: ...

Illustration of anonymous functions: Dissimilar functions stored in the M-files, when no argument is passed to an anonymous function, the parentheses should still be in the fu

Function fieldnames - structure functions, Function fieldnames - structure ...

Function fieldnames - structure functions: The function fieldnames will return the names of the fields which are contained in the structure variable. >> pack_fields = fiel

Smoothing values, How can I use the weighted moving average formula in matl...

How can I use the weighted moving average formula in matlab to smooth a column data of 404 values?

Sound files, Sound Files: The sound signal is an illustration of a con...

Sound Files: The sound signal is an illustration of a continuous signal which is sampled to result in a discrete signal. In this situation, sound waves traveling through the a

Symbolic variables and expressions, Symbolic Variables and expressions: ...

Symbolic Variables and expressions: The MATLAB has a type known as sym for the symbolic variables and expressions; these work with strings. The illustration, to generate a sym

Printrectarea function - subfunction, printrectarea function: functio...

printrectarea function: function call: printrectarea(length, width) function header: function printrectarea(len, wid)   In the function call, there are two argume

Illustration of variable scope, Illustration of Variable scope: Runnin...

Illustration of Variable scope: Running this function does not add any of variables to the workspace, as elaborated: >> clear >> who >> disp(mysum([5 9 1]))

Example of file ploting data, Example of file ploting data: As the oth...

Example of file ploting data: As the other example, a data file called 'compsales.dat' stores the sales figures (in millions) for divisions in a company. Each line in the f

Write Your Message!

Captcha
Free Assignment Quote

Assured A++ Grade

Get guaranteed satisfaction & time on delivery in every assignment order you paid with us! We ensure premium quality solution document along with free turntin report!

All rights reserved! Copyrights ©2019-2020 ExpertsMind IT Educational Pvt Ltd